Skip to content
ELCA Blogs

ELCA World Hunger

New Data Show Trends, Challenge Old Wisdom

Knowing the numbers for hunger and poverty can go a long way to helping us talk about the issues accurately and craft effective, forward-looking responses. For those who share with their congregation information about hunger and poverty, these numbers can also be helpful in putting together presentations or workshops.

There are several sources for data that are particularly reliable and useful[1]:

  • The World Bank’s poverty report;
  • The Food and Agriculture Organization of the United Nations’ (FAO) annual “State of Food Security” report;
  • The US Census Bureau’s annual reports on poverty and income; and
  • The US Department of Agriculture’s (USDA) annual “Food Security in the US” report.

We are still waiting for the release of the USDA’s report, hopefully within the next week, but already, the data are showing some troubling trends and some surprising shifts in understanding hunger and poverty.

Rather than litter this post with a ton of footnotes, the sources are summarized below.

Information and infographics about global hunger and food security come from:
FAO, IFAD, UNICEF, WFP and WHO. 2023. The State of Food Security and Nutrition in the World 2023.
Urbanization, agrifood systems transformation and healthy diets across the rural–urban continuum. Rome, FAO. https://doi.org/10.4060/cc3017en
Information and infographics about incomes in the United States come from:
Gloria Guzman and Melissa Kollar, U.S. Census Bureau, Current Population Reports, P60-279, Income in the United States: 2022, U.S. Government Publishing Office, Washington, DC, September 2023.
Information and infographics about poverty in the United States come from:
Emily A. Shrider and John Creamer, U.S. Census Bureau, Current Population Reports, P60-280, Poverty in the United States: 2022, U.S. Government Publishing Office, Washington, DC, September 2023.


Global Hunger

The first troubling trend in the data is that the spike in hunger we have seen in recent years has not eased. Hunger is still “far above pre-pandemic levels” (FAO, 2023, viii). In 2022, between 690 and 783 million people were hungry. If we look at the middle of this range – 735 million – we find about 122 million more people hungry in 2022 than in 2019 (613 million.) The prevalence of undernourishment, which is the measure the FAO uses to determine the rate of hunger, has increased from 7.9% in 2019 to 9.2% in 2022 – nearly 1 in 11 people around the world.
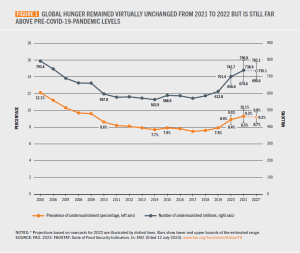
Prevalence and number of undernourished people globally, 2023 (FAO)

Fortunately, that’s come down a bit from 2021. There were about 3.8 million fewer people facing hunger in 2022 compared to 2021, but the number remains remarkably high. The rate of hunger in 2022 was a slight decrease from 9.3% in 2021, but still the highest rate since 2005. In some areas, especially Africa, Western Asia and the Caribbean, hunger continues to rise, in part because of reliance on more expensive exports.

We see even more concerning news if we turn to another measure the FAO reports, namely food security. While the prevalence of undernourishment measures long-term, chronic signs of hunger, the FAO also reports on food security, which is a shorter-term measure of people’s access to safe, nutritious and sufficient food year-round.[2] In 2022, 2.4 billion people were food-insecure, an increase of 391 million people since 2019, relatively unchanged from 2021. This means nearly 30% of people around the world cannot reliably access the food they need.

What is keeping hunger and food insecurity so high?

For starters, one critical factor is the war in Ukraine. The FAO estimates that, without the war, 23 million people would not have faced hunger in 2022. Another factor is rising costs. Food is more expensive, fuel is more expensive and incomes haven’t risen to match the jump in prices. Many countries at risk of hunger are dependent on exports. The “world food import bill,” which measures how much is spent globally on the import of food and food products, reached nearly US$2 trillion in 2022, the highest on record and an increase of 10% from 2021. This puts enormous pressures on importing countries and translates into much steeper prices for consumers. The cost for imports of agricultural inputs, such as fertilizer (a huge export of Ukraine, Russia and Belarus), was even more staggering – $424 billion in 2022, an increase of 48% from 2021. Put together, it’s more expensive to bring food in and significantly more expensive to produce food in-country.

One of the trends impacting hunger and the cost of food is urbanization. More and more people globally are moving into large cities or closer to cities. By 2050, nearly 7 in 10 people worldwide are expected to live in cities. The result of this shift, according to the FAO, is that the old framework of a rural-urban divide simply doesn’t match the world as it is. In general, as people move toward cities, their economic prospects grow, and their risk of hunger and poverty decreases (slightly.) The problem we are seeing now, though, is rapid urbanization without economic growth. While we used to think of hunger as primarily a rural issue globally, the data point us toward understanding the need to attend to a continuum of rural-to-urban, including people who live in the in-between spaces between cities and rural areas.

As people move into cities, their diets change, and this presents a challenge to traditional thinking about hunger. For years, the truism has been that the world produces enough food to meet everyone’s needs. That might not be the case going forward. Between diets changing and more people moving away from food production in rural areas, the FAO finds that “the availability of vegetables and fruits, in particular, is insufficient to meet the daily dietary requirements in almost every region of the world” (FAO, 2023, xxii; 62). The reality seems to be that the world doesn’t produce enough food for everyone in every region to enjoy a healthy diet. Hunger isn’t just a problem of access but of production that meets changing needs – and changing understandings of nutrition and health.
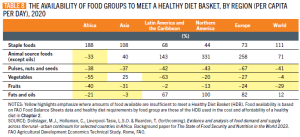
The availability of food groups to meet a healthy diet (FAO)


Another surprising finding is that, in most of the countries the FAO analyzed, the majority of food consumed in rural households is purchased, not produced. This, too, challenges the traditional picture of rural subsistence farmers relying solely on food they grow or produce and makes the relationship between access and production more complex. The reality is that, in rural areas, the share of food that is produced by a household represents only about 33-37% of the food they consume, according to the FAO. The rest is purchased from grocery stores, street vendors or other suppliers.

There are a couple of consequences here. First, the growth in food purchases also means, in many cases, increased consumption of highly-processed foods, which can have lower nutritional value. This may mean that improving food security and nutrition will require new regulations to incentivize healthy eating and prevent exposure to unsafe foods, especially convenience foods purchased from street vendors. Second, focusing on increasing yields and production among rural farmers is important but may need to be combined with other efforts. It may also be important to focus on ways to generate income and to connect people to markets, particularly through improved infrastructure, such as navigable roads. That said, there still needs to be a focus on increasing farming production, especially of fruits and vegetables but also of staple grains, to meet the growing needs of an urbanizing population and to build resilience to shocks to export markets, as we’re seeing with the war in Ukraine.

The long-and-short of it is that the data suggest that the world may face a problem of not producing enough food to meet the changing diets of the world, and rural subsistence, as we tend to envision it, doesn’t completely reflect people’s actual dietary lives. These are huge shifts in our understanding.

Poverty and Income in the United States

As mentioned above, we are still waiting for new data on food security, but we do have information on income and poverty, courtesy of the US Census Bureau.

In 2022, the official poverty rate in the US was 11.5%, representing about 37.9 million people living in poverty. The good news is this wasn’t significantly different from 2021; the bad news is that this rate is far too high and still slightly higher than in 2019, before the pandemic.
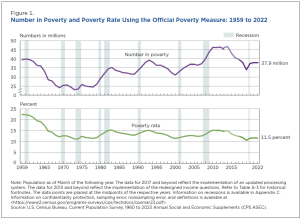
Number of people in poverty and poverty rate over time in the US (US Census Bureau)


One thing to note in the data is geographic differences in poverty. While people living in every type of setting – city, suburb, rural– face vulnerability to poverty, the highest rate of poverty in the US is found “outside metropolitan statistical areas” or, in other words, rural areas. Fifteen percent of people living in rural areas in 2022 experienced poverty, compared to 11.0% living in urban centers (“metropolitan statistical areas.”) In principal cities themselves, poverty remained above 14% for 2022. So, the picture of poverty in the US as being primarily urban is not quite borne out by research; rural areas actually experience poverty at a slightly higher rate.

In addition to the official poverty measure, the US Census Bureau also calculates a Supplemental Poverty Measure (SPM.) You can read more about the differences here, but one of the interesting things the SPM lets us see is how certain safety net programs and benefits help alleviate poverty. It also allows us to estimate how much certain costs contribute to poverty. Moreover, it determines the threshold of income that is “in poverty” a bit differently.

One important caveat before getting into the numbers: the numbers below are from the Supplemental Poverty Measure, not the official poverty measure. While they are illuminating and help us to analyze poverty more deeply, they should not be used as a replacement for the official poverty measure.

Here is where the news gets a bit frustrating, to be honest. We knew when the Child Tax Credit was expanded that we would see a rapid reduction in child poverty, and we did. Of course, that expansion and COVID-19 stipends expired in 2022, so the rate of child poverty in the US went up, as we knew it would. In fact, between 2021 and 2022, according to the SPM, child poverty more than doubled, from 5.4% in 2021 to 12.4% in 2022. At the same time, the official poverty rate for children stayed relatively stable, showing the deep impact the Child Tax Credit expansion had on child poverty. Perhaps even more worrisome is that the share of children in households with income of less than half of the poverty line also doubled, showing an increase of more than 100% for children living in what is considered deep poverty. Increases in deep poverty were true across the board for all age groups. The share of the population with resources below 50 percent of the SPM poverty threshold increased for every age group in the US. What this may point to is the way in which tax credits and stimulus payments had had a particularly significant impact on people living in deep poverty. What it also suggests is that ending poverty for households, even households in deep poverty, is not impossible; progress just takes bold but doable policy choices.
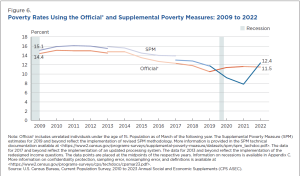
Child poverty – supplemental poverty measure vs. official poverty measure, US (US Census Bureau)


From the SPM, we can also get an idea of how effective certain public programs were in keeping people out of poverty in 2022. As the graph below indicates, for example, the Supplemental Nutrition Assistance Program (SNAP; formerly food stamps) and the National School Lunch Program lifted 5.1 million people out of poverty, while out-of-pocket medical expenses moved 7.1 million people into poverty, which means that, after medical expenses are subtracted from their resources, more than 7 million people had household resources below the poverty line.
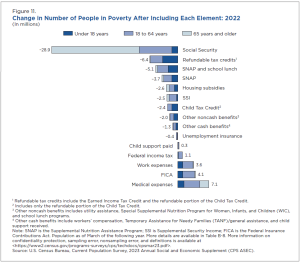
Supplemental poverty measure – the impact of various sources of income or costs (US Census Bureau)


In terms of income, real median household income in the US decreased 2.3% between 2021 and 2022, from an estimated $76,330 per household to $74,580. More people were working full-time, year-round, but real median earnings of workers (including both part-time and full-time) decreased 2.2%. For just full-time, year-round workers, the drop in earnings was 1.3% from 2021 to 2022. So, the next time someone complains about how workers “these days” earn so much, you can gently and gracefully remind them that earnings are lower now than they were last year when accounting for inflation– at the same time (and partially because) goods cost so much more.
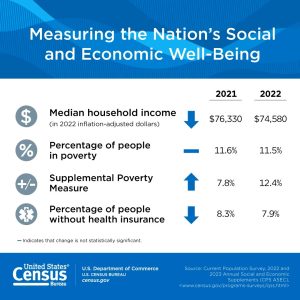
 

Credit: US Census Bureau, 2023


Moreover, the next time someone says, “People just don’t want to work anymore,” it might be helpful to point out that the number of full-time, year-round workers increased 3.4% between 2021 and 2022, compared to an overall increase in workers of 1.7%, which, according to the US Census Bureau, suggests that what we are actually seeing is a shift from part-time work to full-time, year-round work. The percentage of people 16 years and older who were in the labor force in 2022 was 63.5% – not much different from the 63.6% 5-year average from 2017-2021.

In terms of racial disparities in real median income, White and non-Hispanic White households experienced a decrease of 3.5% and 3.6%, respectively, while the change in income for other racial groups was not statistically different from 2021. This change may be because of long-term income disparities. White and non-Hispanic White workers tend to be paid disproportionately higher incomes than other racial groups, sometimes as much as 25-100% higher, and still, despite the modest decrease, get paid real median incomes of $108,700 per year per household, the highest among racial groups. Further analysis shows that the losses in real median income nationwide largely occurred in middle and high income brackets, so this makes some sense.

This drop in middle and high incomes means that income inequality was lower in 2022 than in 2021. In fact, the US Census Bureau reports that 2022 represented the first drop in the Gini coefficient – a common measure of income inequality – since 2007. There is some good news there, though, if we look at other measurements, such as the mean logarithmic deviation of income, which is a bit more sensitive to changes at the lower end of the income spectrum, we still see income inequality at the highest rate it has been since 1967, with the exception of 2021, of course.

What this means is that, yes, income inequality decreased because of drops in income at the middle- and high-income levels. But when the lowest 20% of income earners draw in only 3% of the total income of the country, and the highest 20% get more than 52% of the total income, can we really say that we are making headway on inequality? Probably not. There’s more work to be done.

Where to go from here?

“More work to be done” is a good way to sum up what we can learn from the data. Certainly, we are nowhere near the worst of projections from the early months of the pandemic. But we are also a far cry from the Sustainable Development Goal of ending hunger by 2050.

We know, though, that things do not have to be this way. We have come a long way from where we were as a country and a world in 1974, when the Lutheran hunger appeals that became ELCA World Hunger began. As we look ahead to the 50th anniversary of this ministry next year, we do so with hope and faith. Hunger and poverty are not givens. What the last few years’ worth of data demonstrate isn’t the intractability of hunger but the risk our world runs when we collectively ease up on progress toward ending hunger and poverty.

Working together, learning from one another, listening to each other, advocating together and creating spaces for communities to build trust and address the injustices that create vulnerability will all be important steps along the way.


[1] What makes data “reliable and useful”? One of the first things to consider is whether the sources of data describe their methods, including limitations of the data. This can help point to whether the data are reliable or not. Another factor to consider is consistency. The agencies named in the list use the same methods year after year, so data can be compared over time, and they report any changes to methods that might impact comparability.

[2] In the past few years, there has been more attention to “food crises” around the world and reports that use a measurement referred to as IPC/CH to determine risk of famine. The FAO has a great explanation of how food crisis measurements compare to undernourishment and food security measurements in the 2023 “State of Food Security” report. See Box 1, page 12 of the report.

Conflict and Hunger Part I: How Will the War in Ukraine Affect Food Security?

As the Russian invasion of Ukraine continues, the immediate, deadly consequences are starkly visible in Western media – an as-yet uncounted number of dead soldiers and civilians, millions forced to flee from their homes and seek safety in other countries or regions, and the devastation of homes, hospitals and critical infrastructure. Less vivid but no less significant, are the long-term consequences the war will have for food security in Ukraine and around the globe.

While other causes of hunger, such as climate change, migration or economic poverty, may seem to receive more attention, the single biggest driver of food crises around the world is conflict. As António Guterres, Secretary-General of the United Nations, wrote in 2021, “Conflict and hunger are mutually reinforcing. We need to tackle hunger and conflict together to solve either.” As the World Food Programme (WFP) notes nearly every year in its annual Global Report on Food Crises, conflict often leads to food crises[1] (especially when it occurs at the same time as climate events or economic downturns) and food crises can exacerbate conflict.

Food security depends on the adequacy of four things: food production, food access, food utilization and stability. In simpler terms:

  • Is enough food being produced or supplied?
  • Is the food available to consumers in safe, reliable ways?
  • Are people able to meet their nutritional needs with the food?
  • Is access to food reliable, even during crises?

Over a series of posts, we’ll take a brief dive into each of these. Follow the links to read more:


Reading through each of these posts will give a picture of some of the ways violent conflict impacts hunger, as well as some of the long-term effects that may come from the war in Ukraine. Even as we pray for and take action to support neighbors in Ukraine, we need to remember that this conflict could have devastating and far-reaching consequences that may not go away the moment a ceasefire agreement is signed. Our globalized food system, while so efficient and effective when operating well, also leaves each of us vulnerable to destabilizing shocks around the world.

This is one of the reasons why the complementary responses of Lutheran Disaster Response and ELCA World Hunger through partners and companion churches are so important. Lutheran Disaster Response, working through companions in Eastern Europe, is helping to meet the most immediate needs created by the crisis, while also drawing on years of experience to plan long-term support for refugees, internally displaced persons, and other victims of the war.

Together with Lutheran Disaster Response, ELCA World Hunger accompanies communities around the world as they build resilience against these kinds of shocks. Supporting work in agriculture helps local farmers take steps to improve the productivity of their labors, which provides some security against interruptions in exports or rising prices. Working together with partners and companions in advocacy helps to ensure that social safety net programs are robust and effective in the event of a crisis. Support for healthcare workers, counselors, clinics and hospitals helps reduce vulnerability to disease and illness, care for neighbors dealing with trauma and build capacity to respond to future health crises. And by accompanying refugees and migrants around the world, we can be part of the work God is doing to foster the stability that’s needed to ensure long-term health and well-being wherever they are.

The ripple effects of the war in Ukraine could echo throughout the food system for a long time. But we find courage and hope in God who “calls us to hope, even when hope is shrouded by the pall of war” and who, even now, is at work in, among and through peacemakers, supporting neighbors in need and “striving for justice and peace in all the earth.”

For more information on Lutheran Disaster Response’s ongoing efforts to provide support in Eastern Europe, visit https://blogs.elca.org/disasterresponse/situation-report-eastern-europe-crisis/.


Ryan P. Cumming, Ph.D., is the program director of hunger education for ELCA World Hunger and the author of The African American Challenge to Just War Theory (Palgrave, 2013).


[1] A food crisis occurs when there is a sharp rise in hunger or malnutrition within a geographic region. The World Food Programme uses the Integrated Food Security Phase Classification and the Cadre Harmonise (IPC/CH) to describe levels of acute food insecurity. The classification phases range from Phase 1 (none or minimal) to Phase 5 (Catastrophe/Famine.) More information on the phases can be found in WFP’s Global Report on Food Crises. Phase 3 represents a “crisis,” during which immediate action is needed to protect livelihoods and prevent worsening hunger.

Conflict and Hunger Part II: Food Production

This post is Part II of a five-part series discussing the many ways that violent conflict impacts hunger. The first key aspect of food security is food production, or put another way, is enough food being produced or supplied to meet human needs? Here, we take a look at how conflict impacts this, with specific attention to the crisis in Ukraine. Read Part I and find links to the other posts here.

Violent conflict puts the entire food supply chain at risk. The immediate destruction or occupation of land and storage facilities can reduce the amount of land that is farmed and the amount of food crops harvested. The effects, though, are complex, as research into the recent conflicts in Syria and Iraq has found, since militaries can and do turn some of their energy to cultivating occupied land while local farmers also increase their production (or try to) to meet growing need.

Far more significant than control or destruction of land are the impacts on labor and inputs. Are there enough people to work a farm, and does the farm have enough supplies to keep operating? As people flee their homes in search of safety, farms are often left fallow, crops are left unharvested and livestock are left untended and vulnerable to death or theft, as has been the case in Nigeria, for example, amid the violence of the Fulani militia. Conflict can also make it hard for farmers to get shipments in or out, so obtaining seeds, new animals, machinery and other necessary supplies gets difficult and expensive, if not impossible.

This is a huge problem when it comes to the conflict in Ukraine. It’s no exaggeration to call Ukraine “the breadbasket of Europe.” Agriculture is about 9% of the country’s total gross domestic product (GDP), and Ukraine is a leading producer of wheat, corn, barley, sunflower oil, rapeseed oil and soybeans. Together, Russia and Ukraine provide more than 30% of the world’s cereal[1] supplies. These cereals are essential staples for many countries around the world that rely on Ukraine’s exports – exports that are now at severe risk. As Qu Dongyu, Director-General of the Food and Agriculture Organization of the United Nations (FAO), has pointed out, some cereal crops in Ukraine will be ready for harvest in June. The longer the conflict lasts, the greater risk that these crops won’t be harvested or shipped later this year.

That extends the crisis far beyond the borders of either Ukraine or Russia. Many of the countries dependent on importing Ukrainian grains do so because their own production can’t meet their needs. Some of these counties, such as Yemen (which imports about 700,000 tons of Ukrainian wheat each year), are already facing their own food crises. A shock like this could make famine more likely. On the other hand, because of our interconnected global food system and the widespread concern about the situation in Ukraine, we may see other producers step up to help fill the gaps through increased exports and reduced trade barriers. This, of course, doesn’t avoid other problems, as we’ll see in the next post on food access.


[1] “Cereals” includes a wide variety of grains used for foods, such as rye, barley, wheat, sorghum, maize or rice.

Welcome (Back) New Staff!


Join ELCA World Hunger in welcoming (back) former intern and current coordinator for network engagement, Petra Rickertsen!

Grateful for your warm ‘welcome back’ to the ELCA World Hunger team, I am elated to announce my graduation from 2018 intern to Coordinator, Network Engagement! My passion for working with the ELCA World Hunger began in high school at an ELCA National Youth Gathering, grew through creating educational opportunities at California Lutheran University, and blossomed through hands-on experiences spreading the news of our work as a Hunger Leader on my Synod’s Hunger Team. Along the way, I also worked with Lutheran Retreats, Camps, and Conferences for five summers (after many seasons as a camper), and Fit 4 The Cause throughout college, drawing camp and fitness close to my heart. Serving through each nonprofit fortified my joy for working with people diverse in their walks of faith and life.

Learning about God’s astounding creation from people to plants also piques my interest. It’s part of the reason why I eat vegetarian and feel so blessed to travel! Two great adventures included studying abroad one semester in Paris, then another semester at Oxford University (Balliol and Saïd Colleges) which included additional travel through Greece, Italy, and Israel. I find the most intriguing part of traveling to be learning about the relationships people create with their food and the communities that flourish around food’s journey from seed to body.

Though traveling abroad is brilliant, I’m just as excited for the adventures happening in my own backyard! As a people-person, everything is more fun with a buddy, whether that is skateboarding, camping, or simply staying in for homemade pizza and movie night. I’ll miss the mountains (and burritos).  However, I am curious about what it will be like to trade warm sandy beaches and palm trees on Christmas for dashing through the snow in Chicago. But, I am elated for the growth this change in scenery will bring! Most of all, I’m grateful to be here, supporting the incredible work you and our shared network is achieving through ELCA World Hunger ministries. I am inspired to be back working with you and this team until all are fed.

I’m excited to work with the ELCA World Hunger network in our shared mission to end hunger, from assisting to plan, manage and answer your questions regarding events like the ELCA World Hunger Leadership Gathering, to sharing on social media the astounding work you’re achieving in your communities, and our companions and partners are working on across the world.

Food loss vs food waste: which one is our struggle?

Just last week in my local high school’s cafeteria, eager young volunteers stationed themselves with scales in front of garbage cans. Weighing and examining every item about to be thrown away, they came up with a gross tonnage of discards and determined that only 5% of the “garbage” needed to go to the landfill. The other 95% could be recycled or composted.

While some of the compostable items were napkins and paper plates, most of it was food.

Food tossed into the cafeteria garbage can is considered food waste— food wasted at the level of consumption, that we prepare and eat in our homes, stores, and high schools, the ELCA Churchwide Office, our congregations, offices, and countless other  institutions.

Food loss, on the other hand, takes place at the level of production. Failed crops are a good example. So are shortages triggered by hurricanes, typhoons, droughts, war and violence, and diseases like potato blight or wheat rust.

Through ELCA World Hunger, we’re all committed to addressing food loss. But the food waste that takes place in our own kitchens? Invisible, unchallenged, it’s our dirty little secret. Some might defend it as a privilege of our prosperity! Food loss happens everywhere. Food waste happens in high-income regions. Although this chart is a little hard to see, just look at the proportion of red to blue. Blue is food loss. Red is food waste. We North Americans have the biggest red chunk. (To see a larger chart, go to a cool blog called Discard Studies: Exploring Throw-Away Culture, also my source for the food loss/food waste distinction.)

So, fellow hunger advocates. What’s the plan for making our food waste as visible—and as reprehensible—as the world’s food loss?

For including our own shame in campaigns that focus on the world’s shame?

For adding a photo of our excess to the gallery of photos of other people’s lack?

For including our own practices in the hunger equation?

For looking at ourselves?

I can’t wait to hear.

Anne Basye, Sustaining Simplicity

Planet Earth — megastore or garden?

I have been thinking a lot about the food production and distribution systems in the United States, and was so happy to read Anne’s recent post on our national food culture here.  It’s always comforting to know that others are wrestling with similar issues and ideas — after all, isn’t that one of the reasons we have this blog?

One of the aspects of food production I reflect on is how disconnected we are from the “roots” of our food, and how we can best rebuilt that connection and help those suffering from hunger and poverty.  Both my husband and I come from a long line of small town/suburban backyard gardeners (and some farmers), and I honestly never thought too much about this as being “different”.  When we settled down and bought our first house in a Chicago neighborhood, we were on auto-pilot as we planted a garden and started a compost bin.  We had a tiny yard, but enough room for a few tomato and pepper plants.  Many of our neighbors did too.

As more of our friends also bought first homes and settled in, I began to notice that not everyone planted a garden.  Call me non-observant or naive, but I hadn’t really noticed this before.  Hmmmm.  One of my suburban-raised friends confessed that although she does feed her kids fresh vegetables, she hadn’t grown up eating them and certainly not growing them.  The affordability of purchasing fresh vegetables is a topic for another blog post, but this was not the issue for my friend.

Growing vegetables can be very cost-effective, and doesn’t require vast parcels of land.  One way that domestic hunger can be relieved is through more home gardening — both through donations of fresh produce to food pantries, and through knowledge transfer from experienced gardeners to others — some of whom may be suffering from hunger and poverty.

I recently found this fascinating article “For God So Loved the Dirt . . . by Norman Wirzba in the April 2011 issue of Sojourners Magazine that I wanted to share (you’ll first need to complete the Sojourners online registration process, but it will be worth it).  The author discusses the theology of “God’s garden” as described in various passages in the Bible and how it contrasts with a resource utilization/consumer view of the Earth.  I love the imagery of God as a farmer in overalls, digging in the dirt — does God have dirty fingernails like I sometimes do?

Wirzba’s assertion that local economies enable us to see how our actions may help or harm others is really interesting.  I don’t believe that most people intend to hurt other people, but it’s hard to gauge your impact on someone you never see.  In our global economy, I don’t have to look my farmer in the eye — even if my purchasing decisions might be harming his/her family.  I’m not suggesting that local food is the only “answer”, just that it forces us to really see the other person.

The author concludes with a vision of religious institutions moving away from seeing the Earth as a megastore where you might find a good deal, and instead building the connections between God’s garden and his/her people by transforming parking lots and lawns into gardens.  Although he doesn’t explicitly discuss it, I imagine the author may agree that donating some of that produce to a local food pantry might be nice too.

Looking through the archives, I found that I blogged about this last year here, and that some congregations are already started to dig up their lawns and grow food.  I really like the concept of faith congregations building community around gardening — sharing food, building bridges, and teaching each other.  Are there more congregations doing this since last year?  I hope so.  Could this idea work in your congregation?  Does this article challenge some of your assumptions?  I look forward to your thoughts.

Erin Cummisford

Home again, home again, to our national food culture

“Make half your plate fruits and vegetables,” says the USDA, which recently introduced “My Plate,” a new nutritional icon.

Not a problem for garden-tenders with productive backyards and back fields, or people who live near farmer’s markets and produce stands.  Not a problem for the Obama family, whose 2011 Kitchen Garden is teeming with seasonal produce. Challenging for people in “food deserts” and everyone whose diet is heavy on frozen and processed foods.

This fascinating kitchen garden map hints at the reasons why our national food supply favors frozen pizza over fresh vegetables. It compares two versions of the 2011 White House kitchen garden: the actual garden, and how it would look if it were planted according to how much U.S. taxpayers spend to subsidize crops! (To enlarge the map, hold your control key and hit the plus sign.)

The subsidized garden is devoted to commodities: corn, wheat, cotton, soybeans, and rice. A lot of them, like 70 percent of our wheat crop, end up as processed food. While 80 percent of the rice crop is eaten as just plain rice, about 20 percent goes into processed food or beer. Corn, the only vegetable on this list, ends up as animal feed (40 percent), ethanol (33 percent), or things like corn chips and high fructose corn syrup that nutritionists recommend we avoid. Soybeans become oil, livestock feed, or even cement. Way up in the corner you can see “fruits, vegetables, nuts, and other specialty crops” which receive one-half of one percent of subsidy dollars.

This is not a polemic about crop subsidies but my next step in pondering the subject of local food cultures. After eating so well and so darn locally during my pilgrimage across northern Spain, I’m curious about the foundational ideas and policies of our own food culture. Lots of helpful stuff has been posted on this blog, like this review of the movie “King Corn”. Nancy Michaelis brought up the subject of our lack of crop diversity long ago.  On her visit to a food desert in Detroit, Julie Reishus ran into lots of products made with commodity crops and very few fresh fruits and vegetables.

But we don’t seem to talk about the farm bill, food subsidies, or the values that are built into this system…and how our participation in this system impacts not just our own diet and health, but the world’s food supply.  Hmmm. I guess it’s time to finish my half-read copies of Kingsolver’s Animal, Vegetable, Miracle and Pollan’s The Omnivore’s Dilemma—and time to put a little more energy into understanding agricultural policy. Unsubsidized fruit and vegetable growers are my new neighbors, and now that our rainy spring has ended, their tractors are out in force, prepping for a new season and new crops. If I’m going to live in farm country, if I’m going to eat locally, I have a lot of learning to do.

Anne Basye, Sustaining Simplicity

Animal-less meat?

Would you eat a hamburger that was never part of walking, breathing cow? Apparently we’re not too far from that as an option. Stem cell research is allowing scientists to take two cow stem cells, put them in a petri dish, and grow cow muscle, just like the kind we normally remove and consume from an actual animal. Okay, in practice the process of growing meat in a dish is a little more complicated than that. But not in concept or result. Because the petri dish meat came from cow cells to start with, the resulting meat is, indeed, “real” meat.  You can read about it in an article in the May 23rd issue of The New Yorker titled, “Test-Tube Burgers.” 

Why would we want to eat meat from a lab? The article cites the United Nations Food and Agriculture Organization when it explains “the global livestock industry is responsible for nearly twenty percent of humanity’s greenhouse-gas emissions. That is more than all cars, trains, ships, and planes combined. Cattle consume nearly ten percent of the world’s freshwater resources, and eighty percent of all farmland is devoted to the production of meat.” Then there are the well-documented problems of waste lagoons, use of antibiotics, and the treatment of animals in industrial meat production facilities. Add to all that the growing world population and the increase in demand for meat as countries like India and China get wealthier, and the current system for providing meat seems rather unsustainable. The petri dish offers a potential alternative that could mitigate or eliminate many of these issues. Perhaps the better question is why wouldn’t we want to eat meat from a lab?

There’s certainly an ick factor.  It’s similar to the notion, in the culture of the U.S., of eating insects, though they, too, offer an potentially excellent source of protein without some of the drawbacks of meat (something I blogged about a long time ago). But at least bugs are naturally occurring in nature. Meat in a lab wouldn’t happen without people and labs, which makes it more suspect – at least to me. The New Yorker article points out “lab-grown meat raises powerful questions about what most people see as the boundaries of nature and the basic definitions of life.” And yet, if lab meat could be produced in large quantities inexpensively (as they think will ultimately happen), could help provide food and good nutrition to people who can’t afford “traditional” meat, and if it could be done without many of the currently problematic impacts of meat production, what does refusing to eat it say?

I hesitate, but I think I would eat it. What do you think? Would you try lab-grown meat?

Nancy Michaelis

Shopping for a GMO free meal

As the genetically modified food debate continues, I thought I would add my two cents through a bit of an everyday experiment. Yesterday, I went to the grocery store in search of a GMO free meal. I wondered how hard it would be to find these foods, how expensive they would be and what I would discover along the way. A lot of food crops in the United States are genetically modified. Corn, soy, canola and cotton top the list. You may not normally think of cotton in relation to your food, but check many candy bar labels and you’ll find cottonseed oil. I tried my hardest to not buy any foods with ingredients like “malodextrin” (usually a corn product), because I couldn’t guarantee that it didn’t come from a genetically modified plant. Perhaps this sounds a bit overboard, but it was my intention to be thorough!

I started with two main assumptions. 1: Organic foods are not genetically modified. I looked this up through the USDA Organic web site. According to their National Agricultural Library, “Organic food is produced without using most conventional pesticides; fertilizers made with synthetic ingredients or sewage sludge; bioengineering; or ionizing radiation.” 2: Foods in the USA do not require genetically modified ingredients to be labeled as such.

So off I went!

I pulled in to a big chain grocery store, grabbed my reusable shopping bags and headed in. Before I left I decided what I wanted to eat that night. I thought that if I had a goal in mind, I would be better prepared to get serious about my ingredients. I started in the produce aisle. Shopping list here: greens for salad and two pears. Admittedly, this wasn’t that difficult. I grabbed some organic Spring Mix for salad and a couple of organic pears, stopped at the nut display for some organic walnuts (who knew you could buy organic nuts??), checked out the refrigerated salad dressing and moved on. To the non-refrigerated salad dressing aisle I went.

My goal was vinaigrette, either raspberry or balsamic. Admittedly, I had no idea if these were really worth worrying about when it came to GMOs. What I found were ingredient battles like corn syrup vs. evaporated cane juice and salt vs. sea salt. There weren’t any balsamic vinaigrette options with an organic label. I thought that was good, all organic might be boring. I ended up with a roasted hazelnut and extra virgin artisan vinaigrette. I was sold by the sea salt, evaporated cane juice, lack of ingredients I couldn’t pronounce, and blaring capitalized word “VEGAN” on the back label. Although there were those two ominous ingredients that I couldn’t verify…who knows what “natural flavor” means and I can neither confirm nor deny the presence of GMOs in the canola oil. Well, we can’t be perfect.

On to chicken! It took awhile but I finally found the organic chicken. Why, you might ask is this important to my GMO free meal? Well, it’s really more about what the chickens ate than anything else (that and my will to eat meats without added hormones and antibiotics.) The label on this meat said, “100% organic vegetarian fed diet.” Okay, no, I’m not a farmer and yes, I know that chickens are technically omnivores, but in this case my goal of no GMOs continued – none in the chicken feed, none in my chicken!

Next, brown sugar. Although I already had sugar at home, I wanted to make sure that every little part of my meal had been scrutinized. So, for my candied walnuts, I thought I should start comparing sugars. Once again, I ran into the issue of my limited knowledge…are GMOs an issue with sugar? I decided not to take any chances. I bought an organic store brand of light brown sugar that clearly said on the label, “…made from organic sugar cane grown without the use of synthetic pesticides or genetic modification.” Bingo! Two more ingredients and I would be ready to start cooking; bread (or rolls) and gorgonzola cheese.

I thought bread was going to be tough. Rumors abound about GM wheat crops. So I searched high and low to find some super organic bread. It had all sorts of reassuring ingredients, down to the organic soybean oil (and that one is rather important as 89% of soybean crops in the US are genetically modified). So far, however, all of my online research claims that there is no genetically modified wheat currently being grown for sale anywhere in the world. Very good to know!

Last, but not least was the cheese. I ended up with Amish blue cheese. Yum!

Dinner!

What did I learn? First off, that there are a lot of ingredients in the food that we commonly eat. I ended up with foods containing fewer ingredients nearly all of which I could pronounce. Second, there were unexpected ingredients that I didn’t anticipate having to think about. For instance, I didn’t anticipate the need to check out the soybean oil in bread. Third, I noticed that sea salt, organic cane sugar and vegan labels were common place on much of the food I bought, whether or not it was labeled “organic.” Also, the organic brown sugar I used to candy the walnuts smelled rich like molasses, amazing! While it took me longer to shop, as I read the labels so thoroughly, and was more expensive than conventionally grown foods, for me, it was worth it.

In the end I had a very scrumptious dinner that also felt great to eat. It was full of color, somewhat low on the food chain and involved all of the food groups.

And that is my experience shopping for a GMO free dinner. Also, if you haven’t deduced my meal yet it was a lovely mixed green salad with blue cheese, pear slices, candied walnuts, chicken and a slice of bread with a little extra blue cheese on top.

Thanks for reading!

~Lana

The cow’s surprise

Two weekends ago I visited a local creamery with my siblings, friends and our significant others. There were six of us in total and after tasting multiple delicious cheeses and taking pictures of the cows behind the fence, we were lucky enough to visit the milking room. We stood in a line along the wall, not seven feet from three huge cows being milked by one of the family members who runs the farm. As we asked him questions about the cows, the taste of the milk and the creamery in general, we were in for a very “natural” surprise. As three cows transitioned out of the milking room, three new ones came in, and without time to react we were all splattered with the brownish green leftovers of the cow’s lunch…if you know what I mean. (Don’t worry, everything collecting milk was completely clean and sanitary!) At first I bolted out of the room, saving myself from more splatters (it had already hit my forehead), but then I laughed and thought about the reality of the milk I drink and the cheese I eat.

Cows are animals. They live and breathe and eat and, well, splatter the milking room.  I couldn’t help but smile, knowing that that day I had come a little closer with my food and drink. Everyday people all over the US and the world milk cows and goats for milk, cheese and other dairy products. Everyday they feed their animals and prepare to sell their nutritious foods at market. Everyday we play a role in consumption and conservation through our food choices.  Are we buying local, organic and/or fair trade? Are we aware of where our food comes from and how it is made?  I know that I now have a greater respect for my cheese and the farmers who see it through from grass, to cow, to cheese cave.

~Lana Lile