With so much information out there, it can be difficult to know the most accurate statistics for measuring hunger and poverty. But knowing the data about what is happening can go a long way to helping us talk about the issues accurately and craft effective, forward-looking responses. For those who share with their congregation information about hunger and poverty, these numbers can also be helpful in putting together presentations or workshops.
Below, we have compiled the data from the most reliable sources we have for official numbers on poverty and hunger in the United States and around the world. You can download the slides to put directly into a presentation or use the numbers in your communications and work. You can also download the entire Power Point presentation at the link at the end.
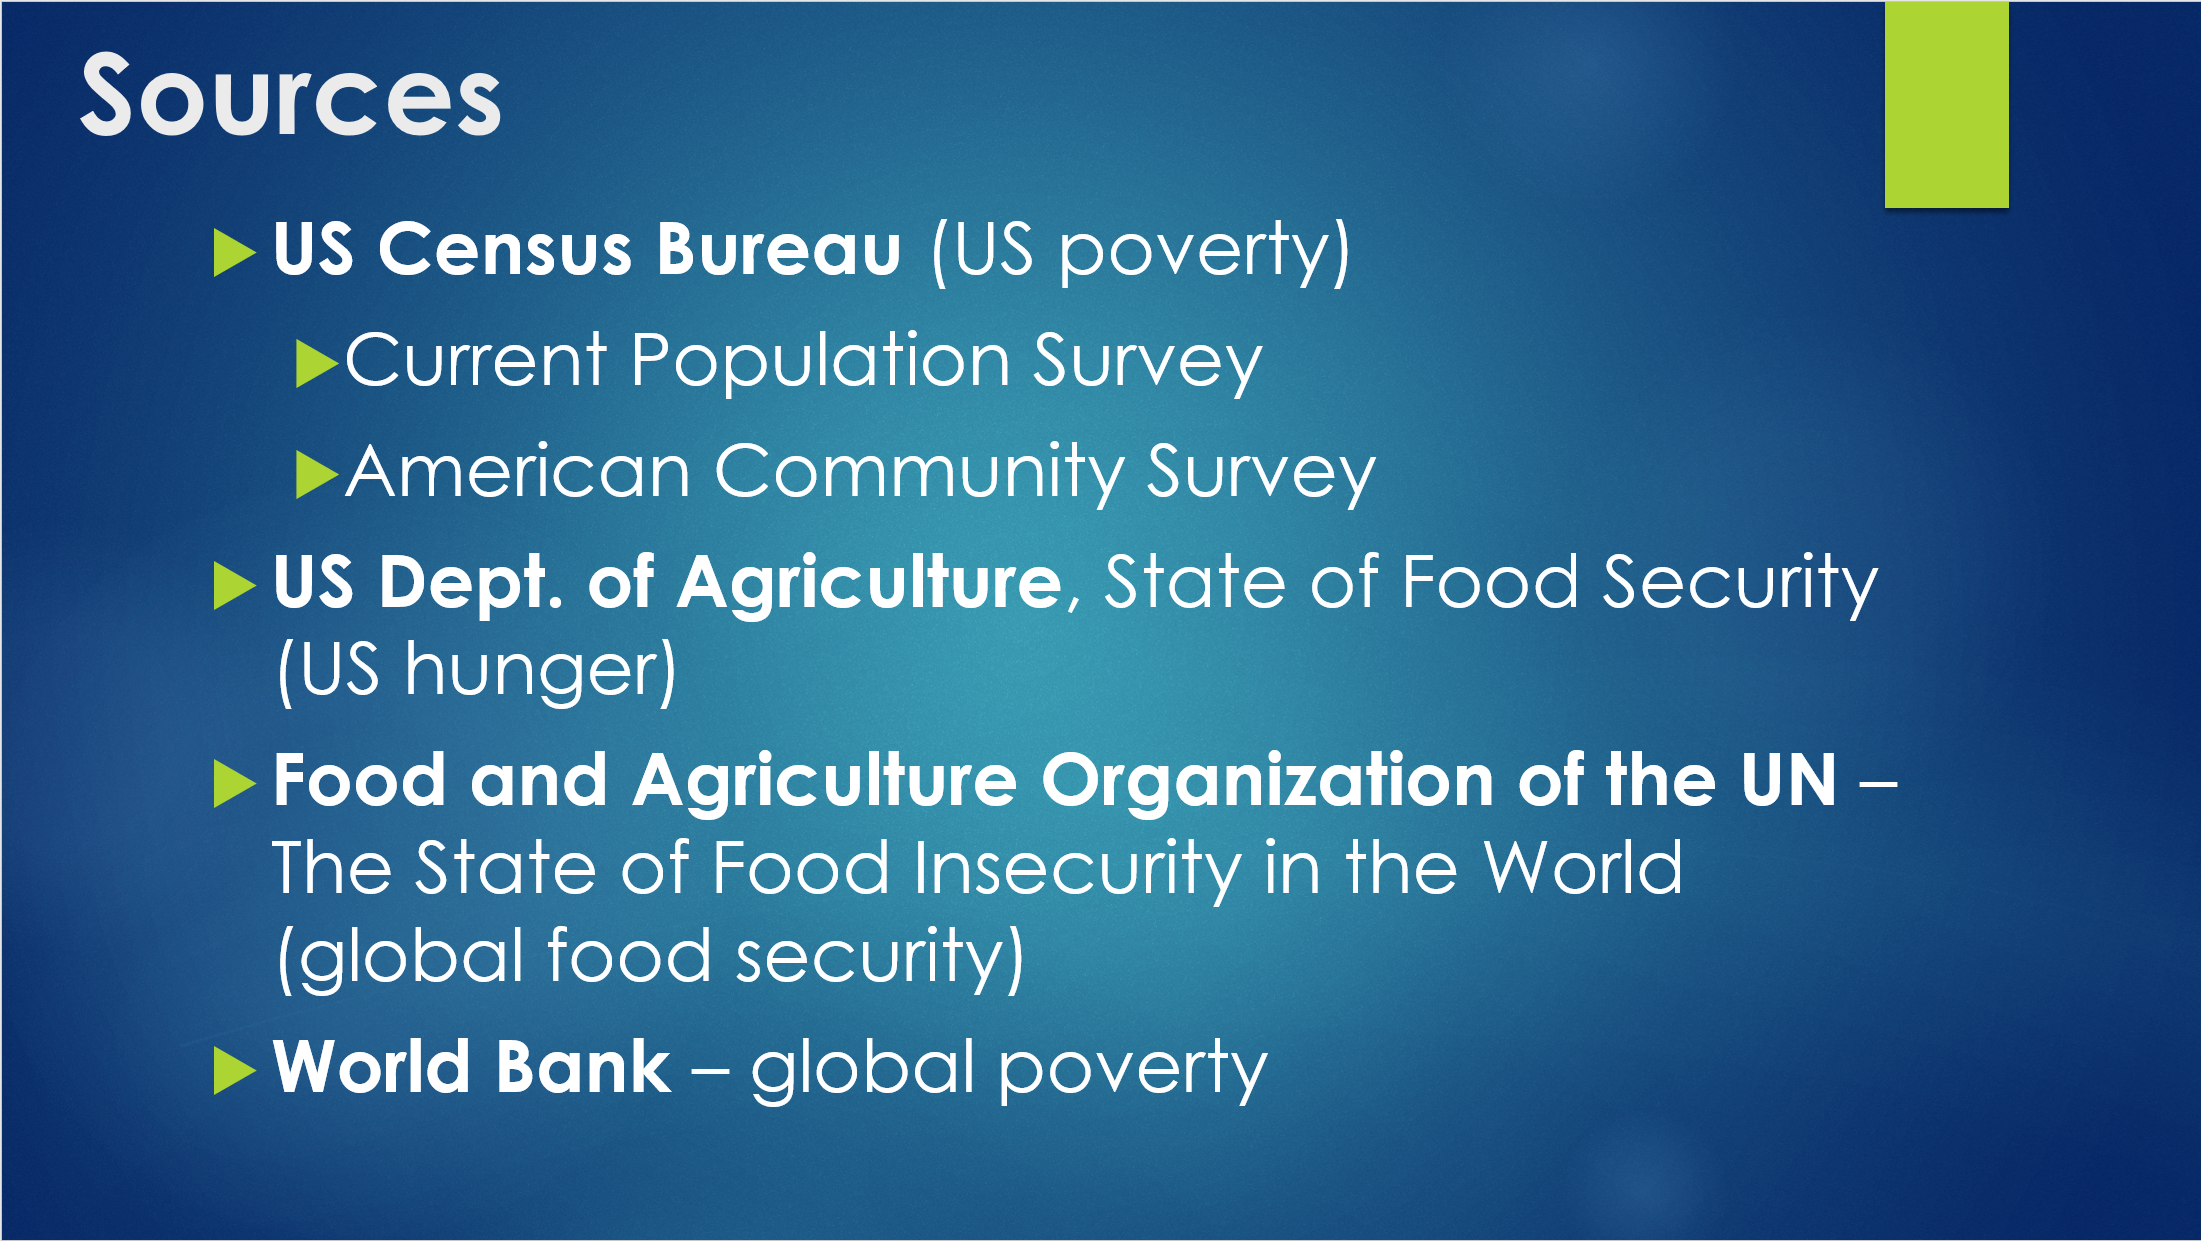
ELCA World Hunger relies on several sources for data:
- US Poverty – the US Census Bureau’s American Community Survey and Current Population Survey, compiled annually;
- US Food Security – the US Department of Agriculture’s annual “Food Security in the US” report;
- Global Hunger – the “State of Food Security and Nutrition in the World” report compiled annually by the Food and Agriculture Organization of the United Nations;
- Global Poverty – the World Bank’s reports on poverty worldwide
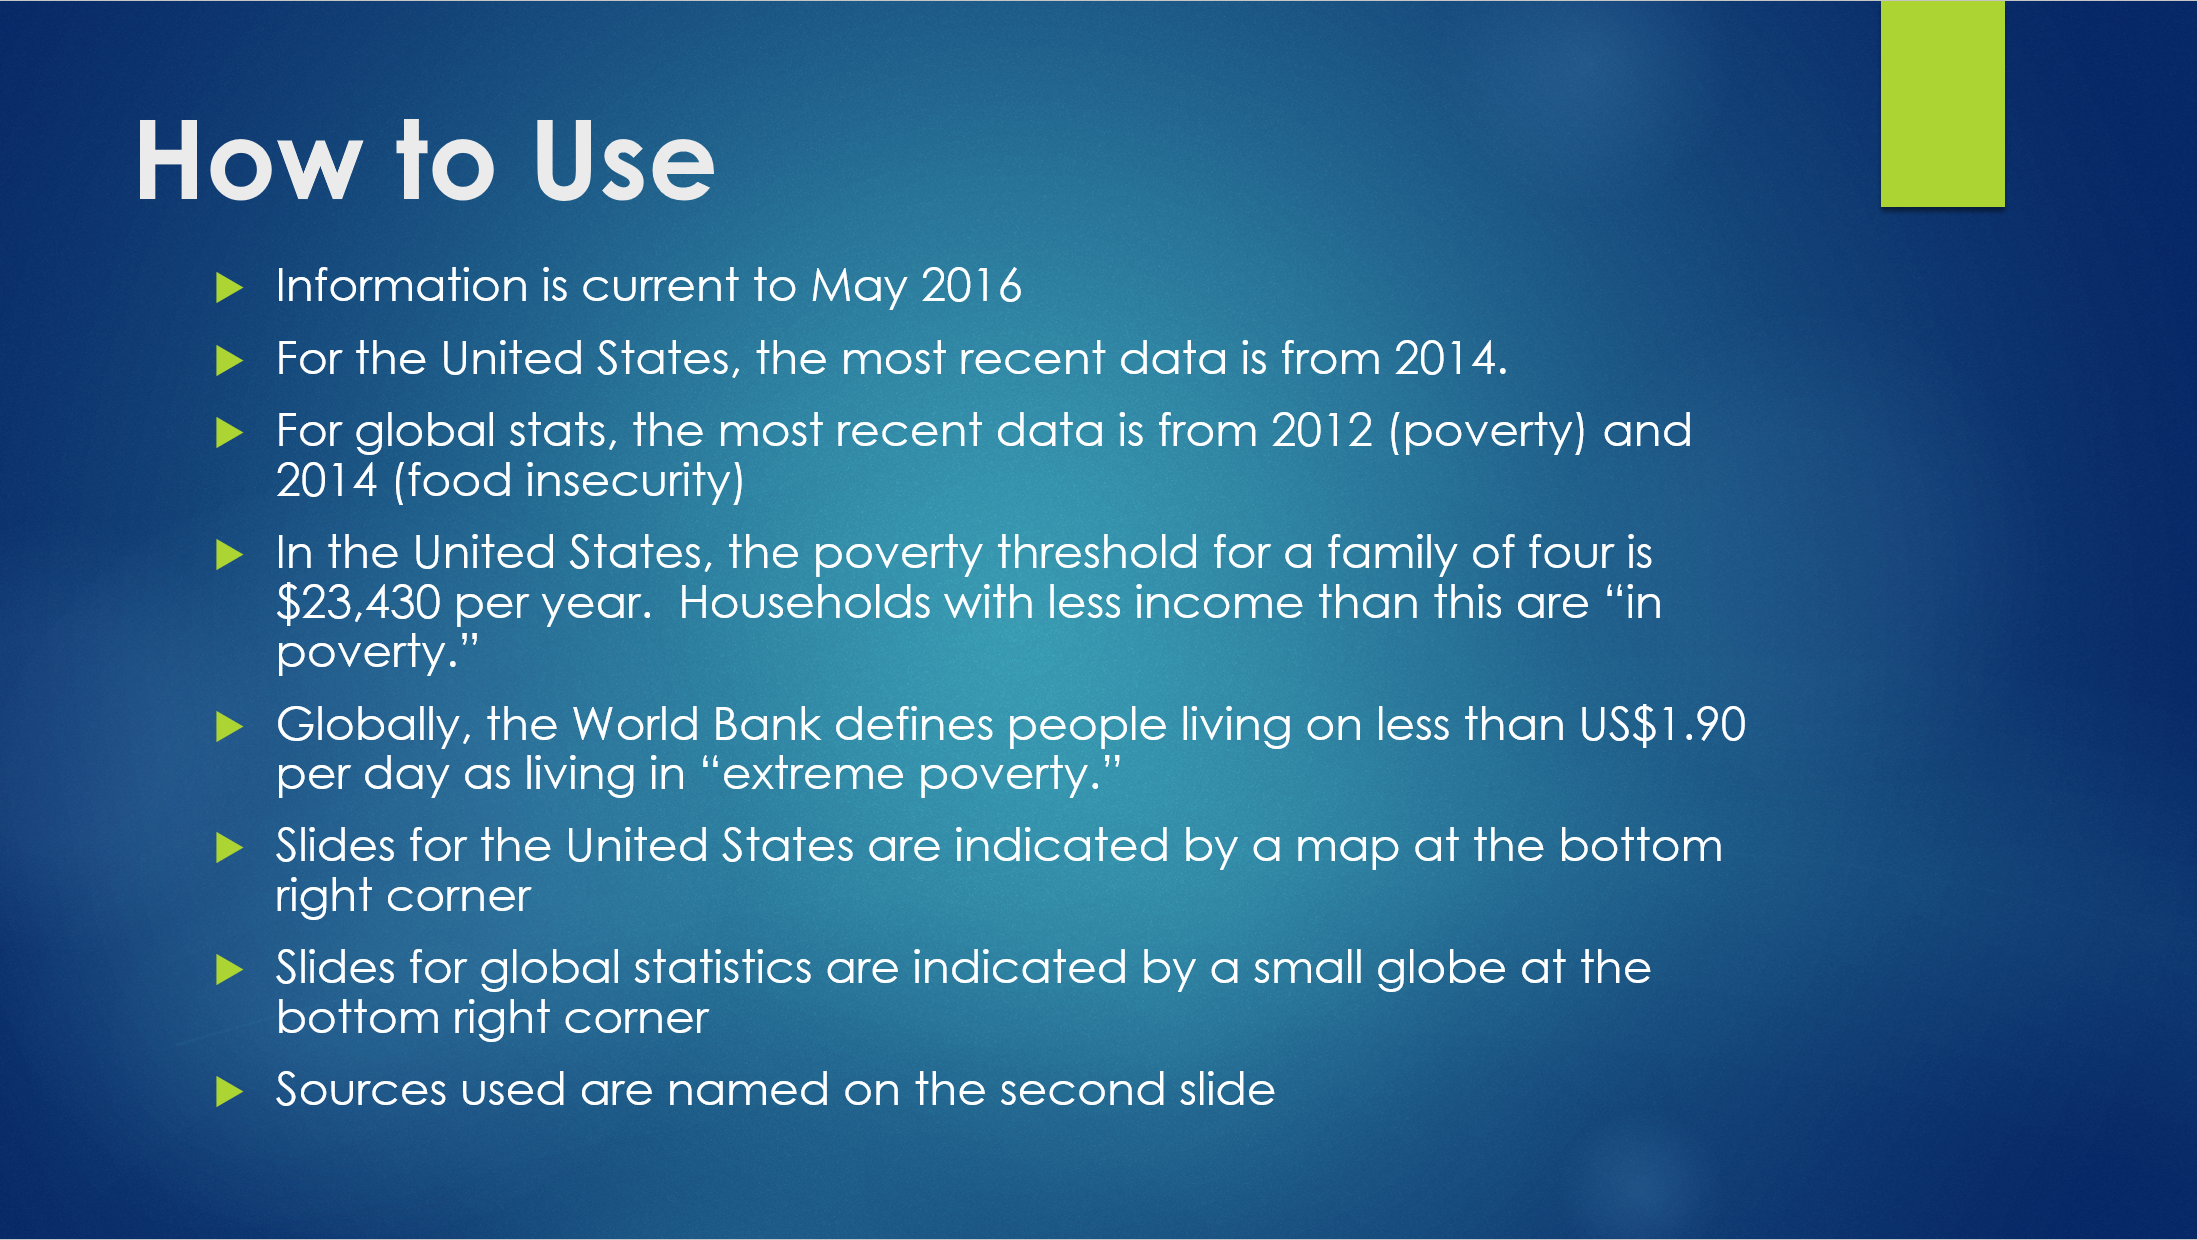
*One important note before we get started is that data are always for previous years. Below, we’ve indicated what years are being measured by the data. These are the most up-to-date statistics available from the sources. All statistics, graphs and charts come from the respective sources listed above.
U.S. Poverty
We’ll start off with data about the United States. Here are the thresholds used to measure poverty in 2017:

The poverty thresholds are reported here as averages for households by number of people. The Census Bureau takes into account the age of householders and the number of children to determine the threshold. So, for example, for a household of four, the average poverty threshold is $25,094. The range, though, is $24,944-$25,283, depending on the characteristics of the household. You can see another example in the slide under the household of a single person.
Another important point here is that the poverty thresholds differ from the poverty guidelines.
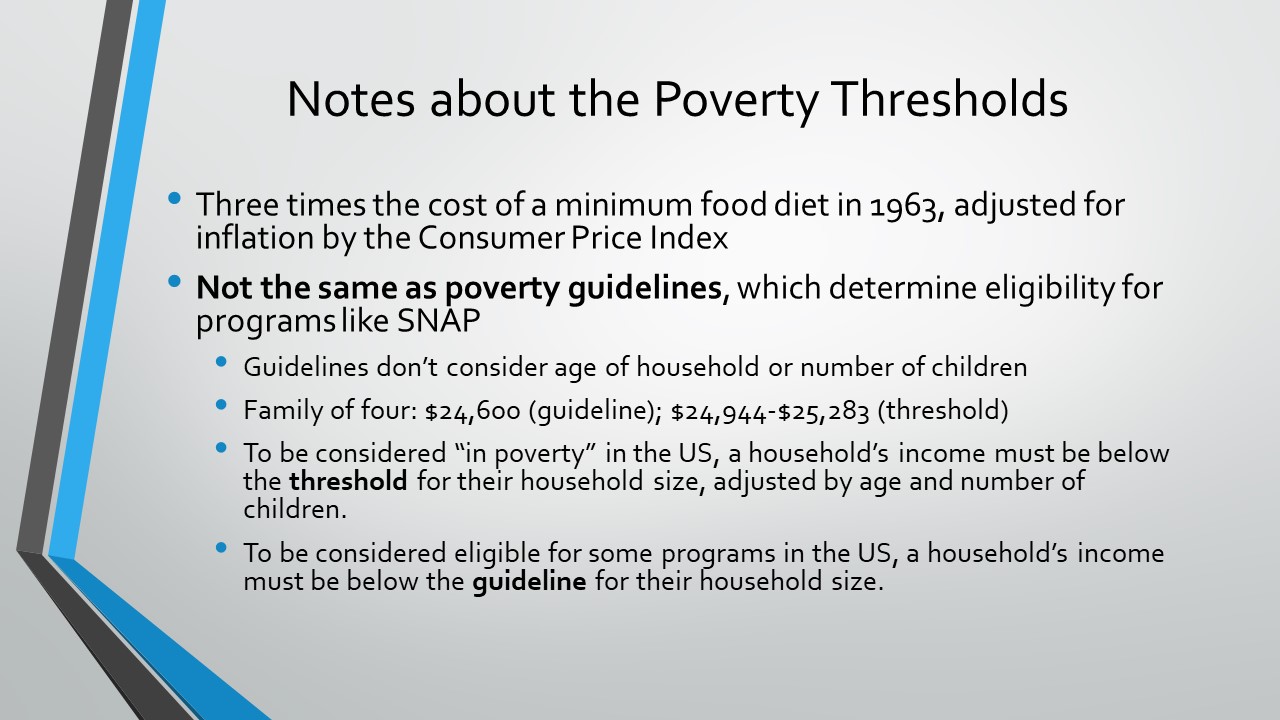
The guidelines are used to determine eligibility for certain government programs, like the Supplemental Nutrition Assistance Program (SNAP; formerly food stamps). The guidelines don’t vary based on age or number of children. The thresholds are used to measure poverty. The thresholds are based on three times the cost of a minimum food diet in 1963, adjusted for inflation.
To be considered “in poverty” in the US, a household’s income must be below the threshold.
To be considered eligible for some government assistance programs, a household’s income must be below (or below a certain multiple) of the poverty guideline.
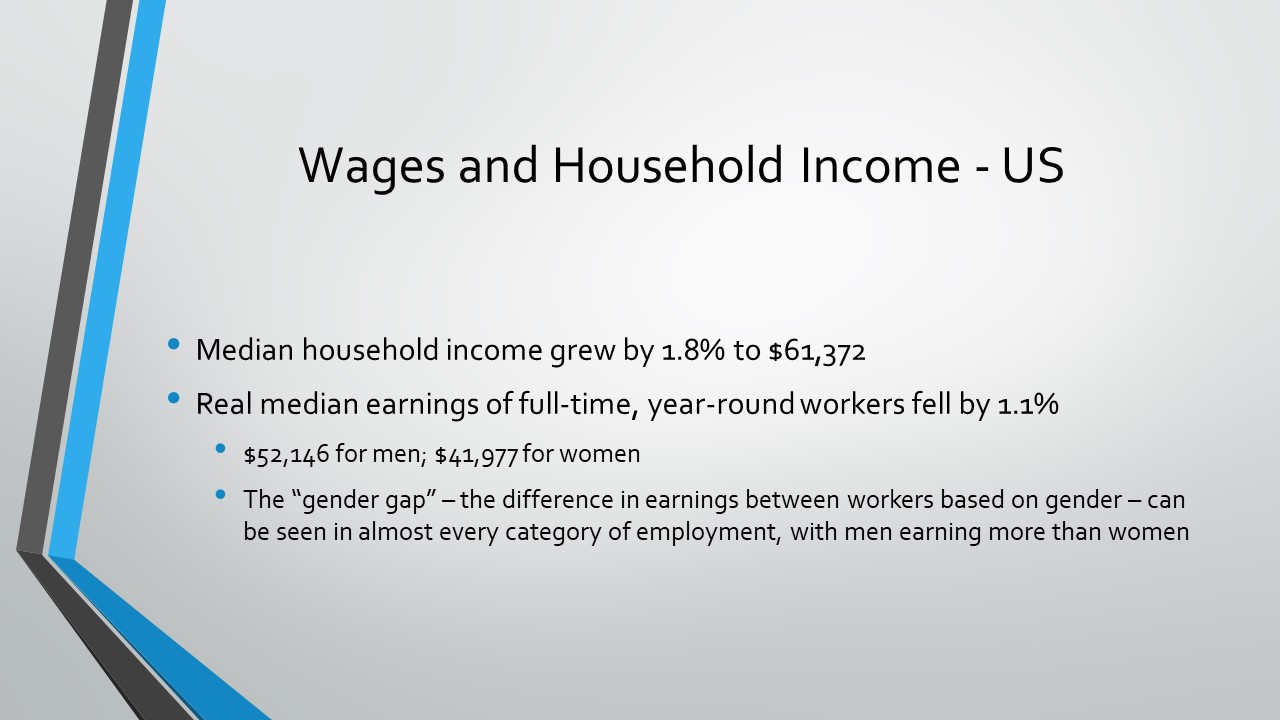
The economy in the US has been growing in terms of employment and median income, but the data seem to point to some contradictions in this growth. Median household income has grown from 2016 to 2017, but real median earnings (wages) have declined. What explains the difference? It would seem that either people are working more hours or more people in the household are working. Both would make the household income increase while wages are decreasing.
Source: US Census Bureau
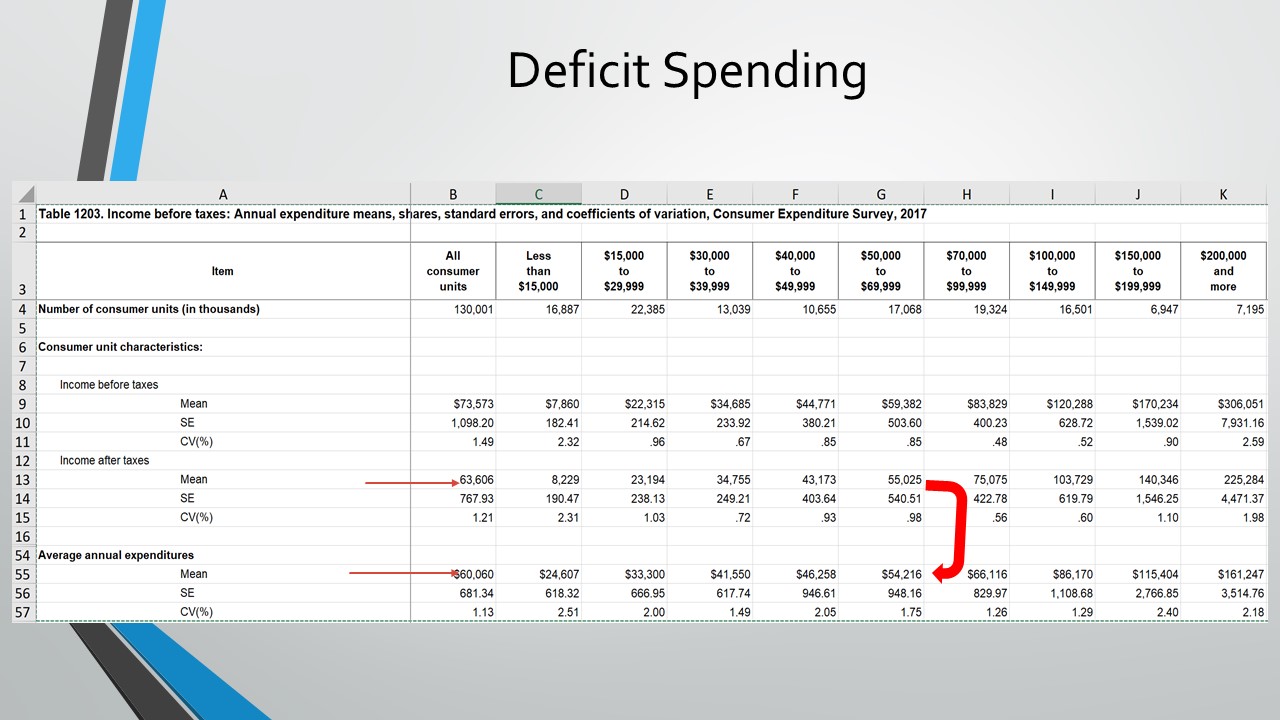
One of the other worrisome trends is that there appears to be a good number of folks spending more money than they are making. The table above shows income before taxes, income after taxes and average annual expenditures. The red arrows indicate the comparison between income after taxes and expenditures for all households. It appears that for all income groups making less than $50,000 after taxes, their expenditures exceed their income. It isn’t until we reach the big red arrow (under the group making between $50,000 and $69,999) that the income starts to exceed expenditures.
It could be that people are misreporting their income, leaving off sources of income like government assistance. Or, it could be that people are drawing on more credit. But either way, it would appear that a great many Americans are unable to sustain their expenditures on their own income.
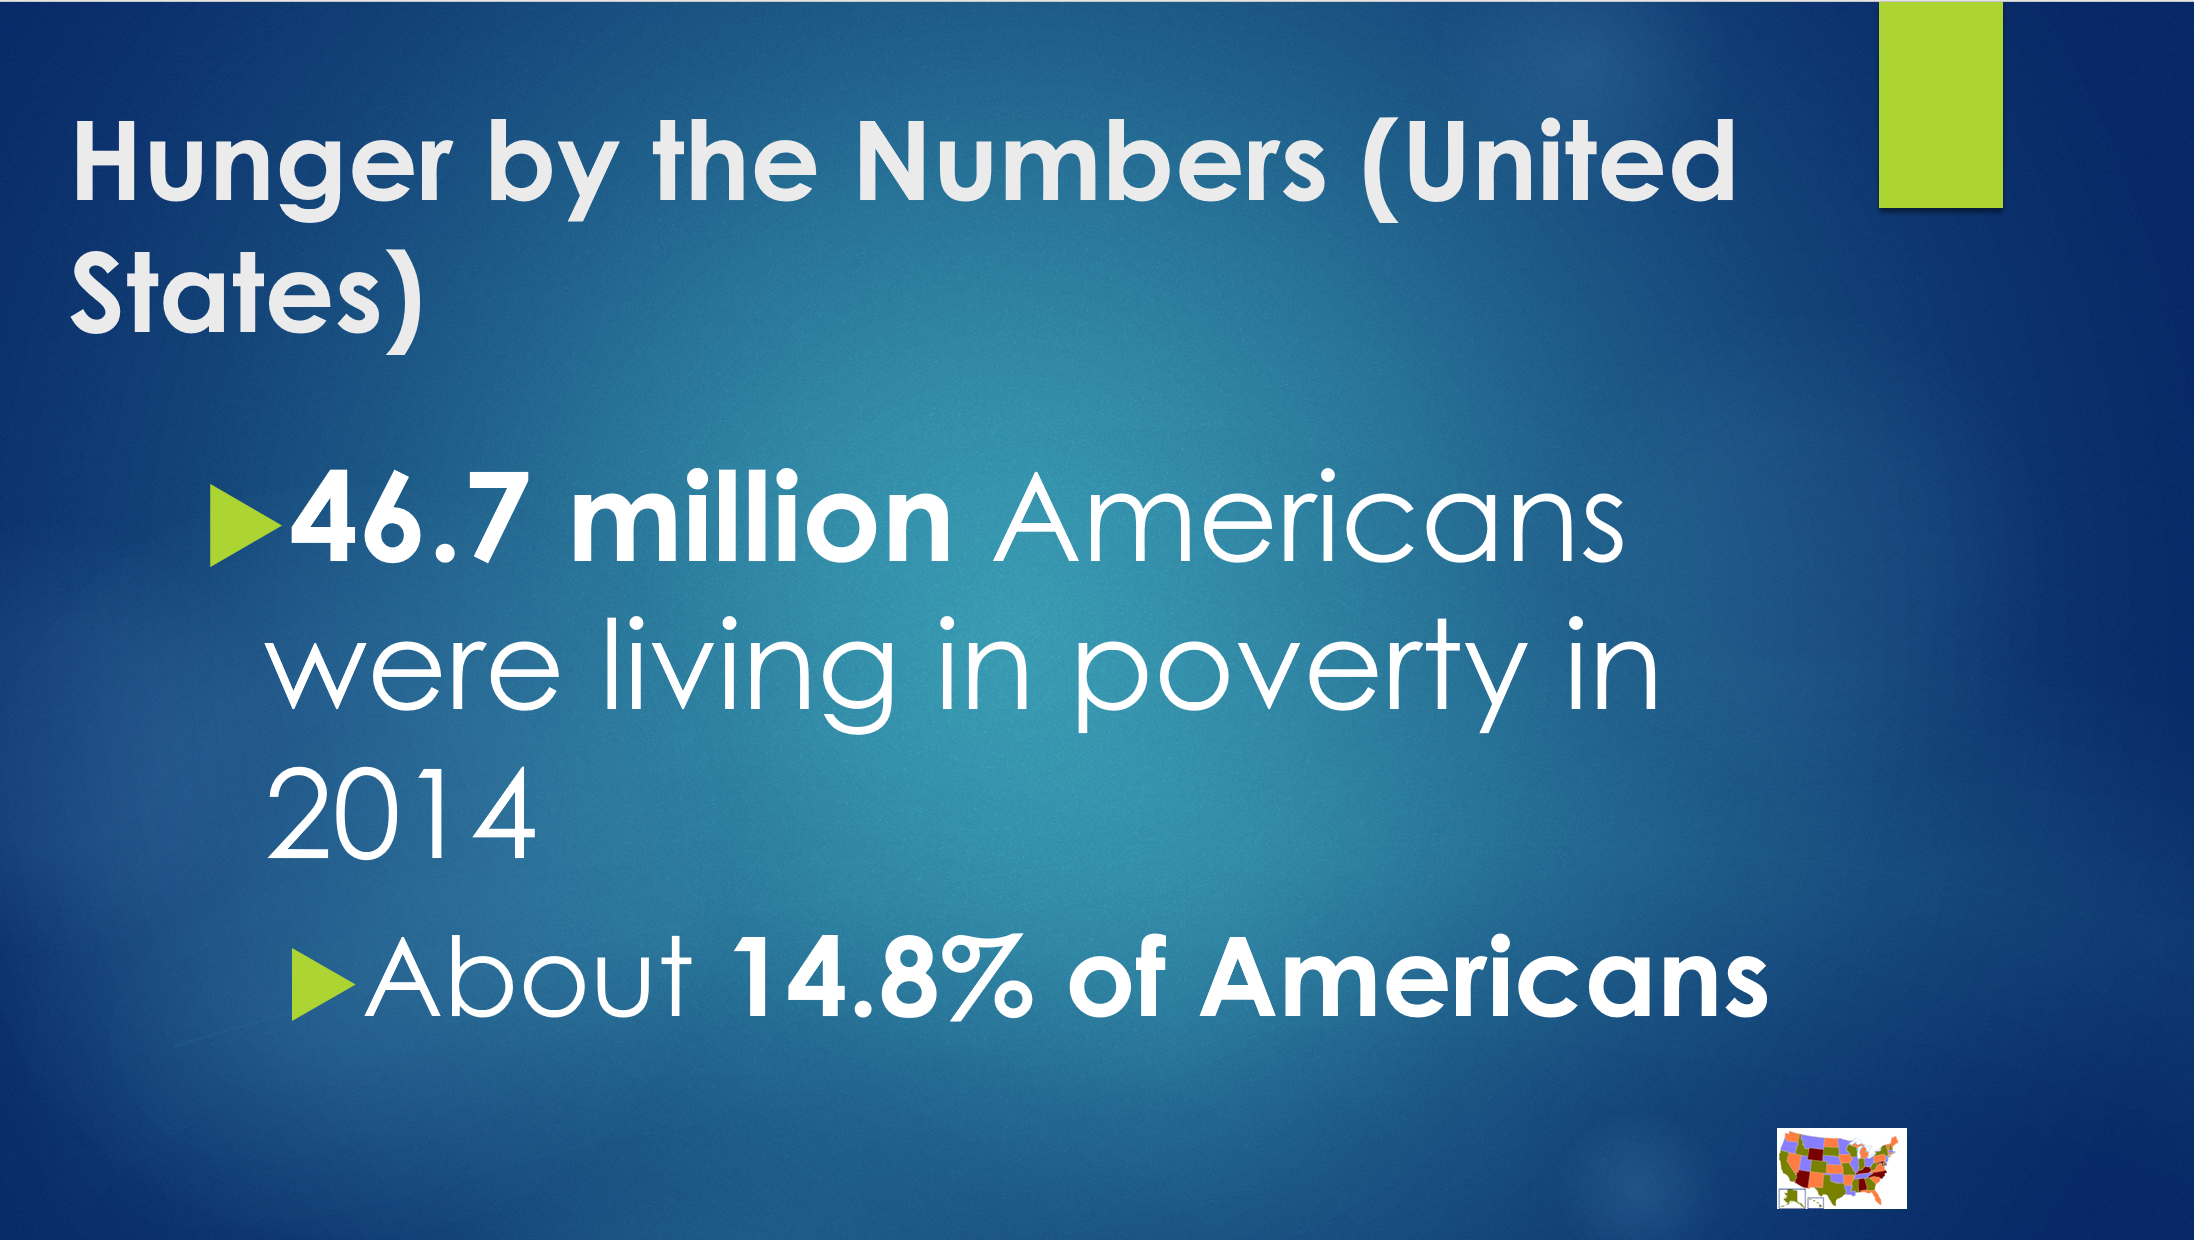
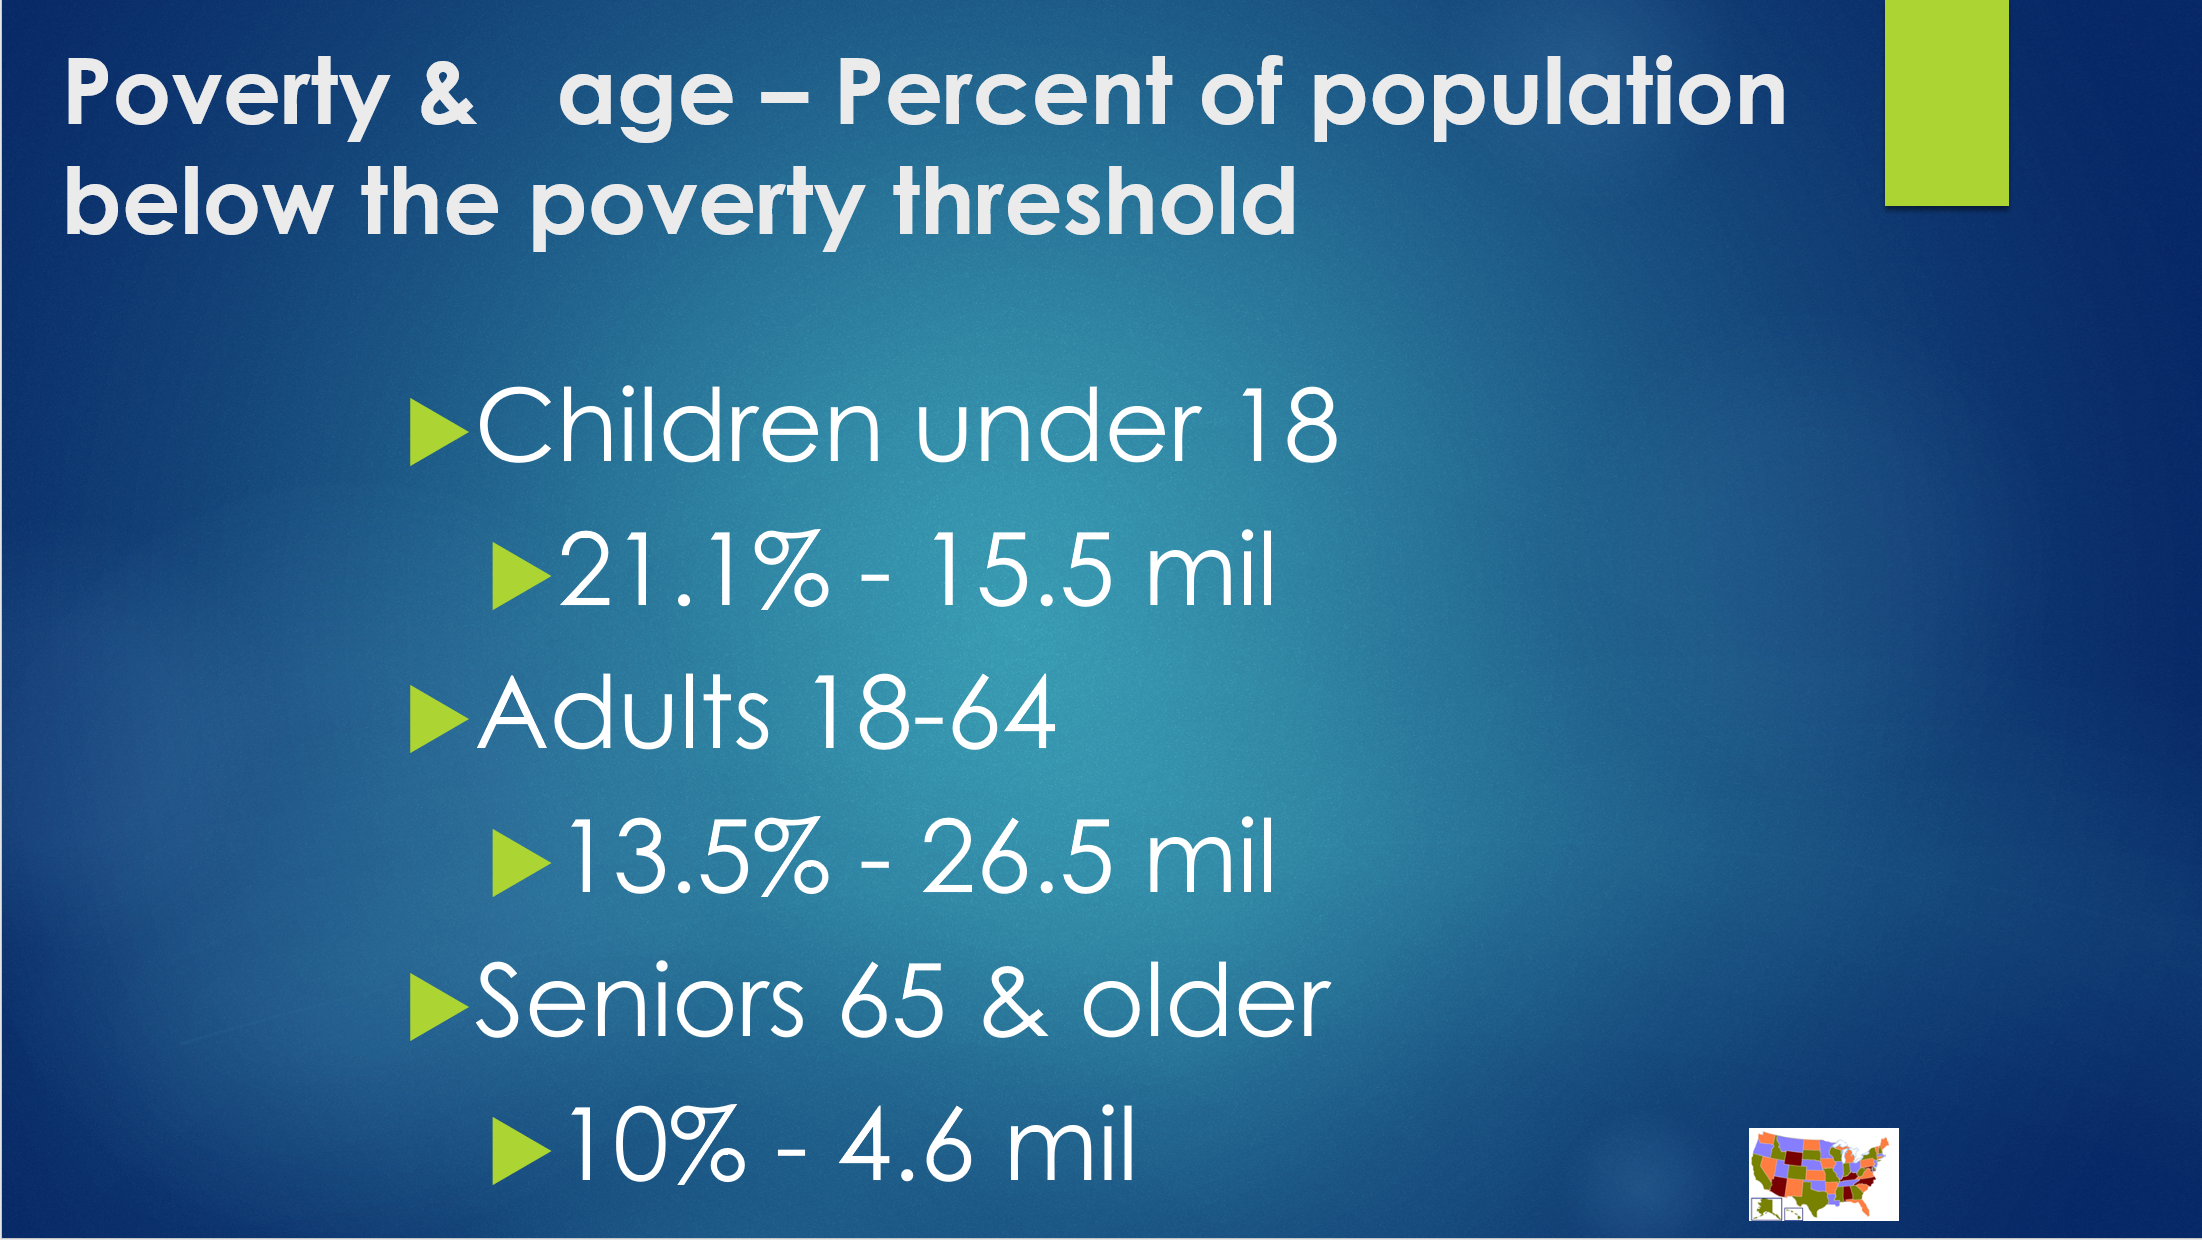
Here are the official numbers of people in the US with incomes below the poverty threshold:
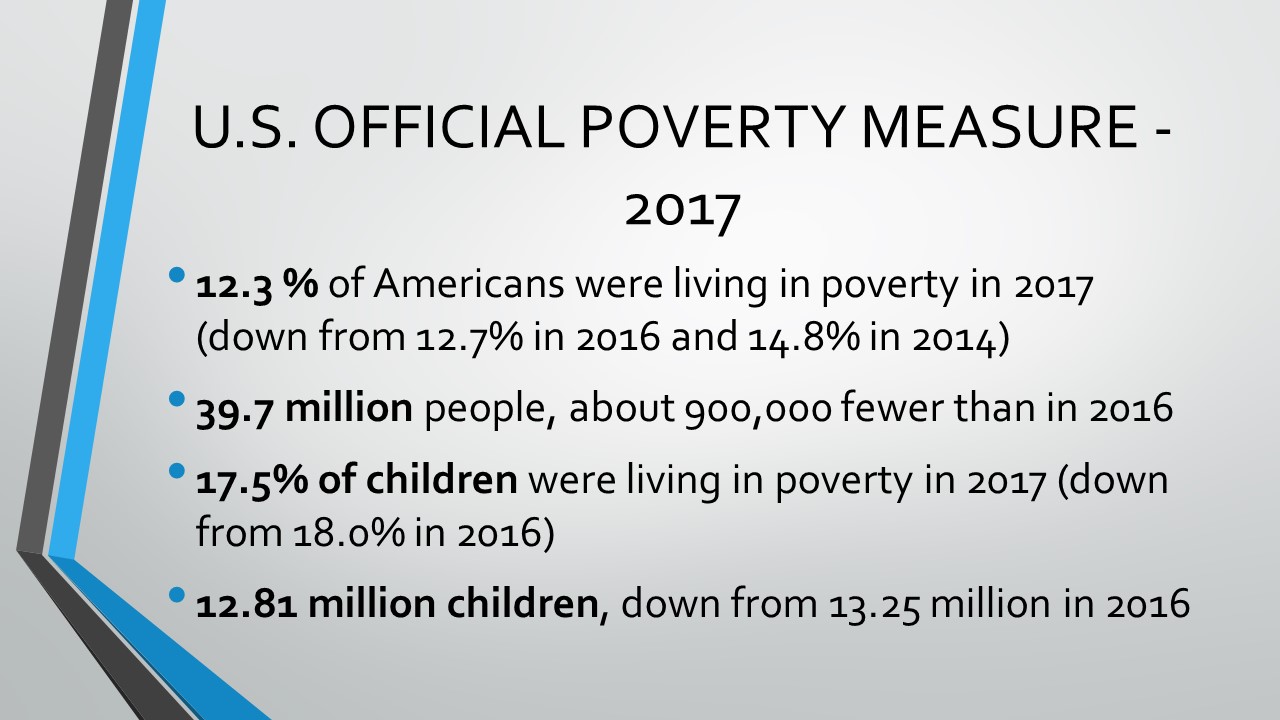
We see a slight decrease nationally, though the number is still really high – about 39.7 million people living in poverty in 2017.

When we look at the education level of people in poverty, interestingly, the only group that saw an increase was people with at least a bachelor’s degree, though they still have the lowest rate of all people based on educational level.
U.S. Food Insecurity
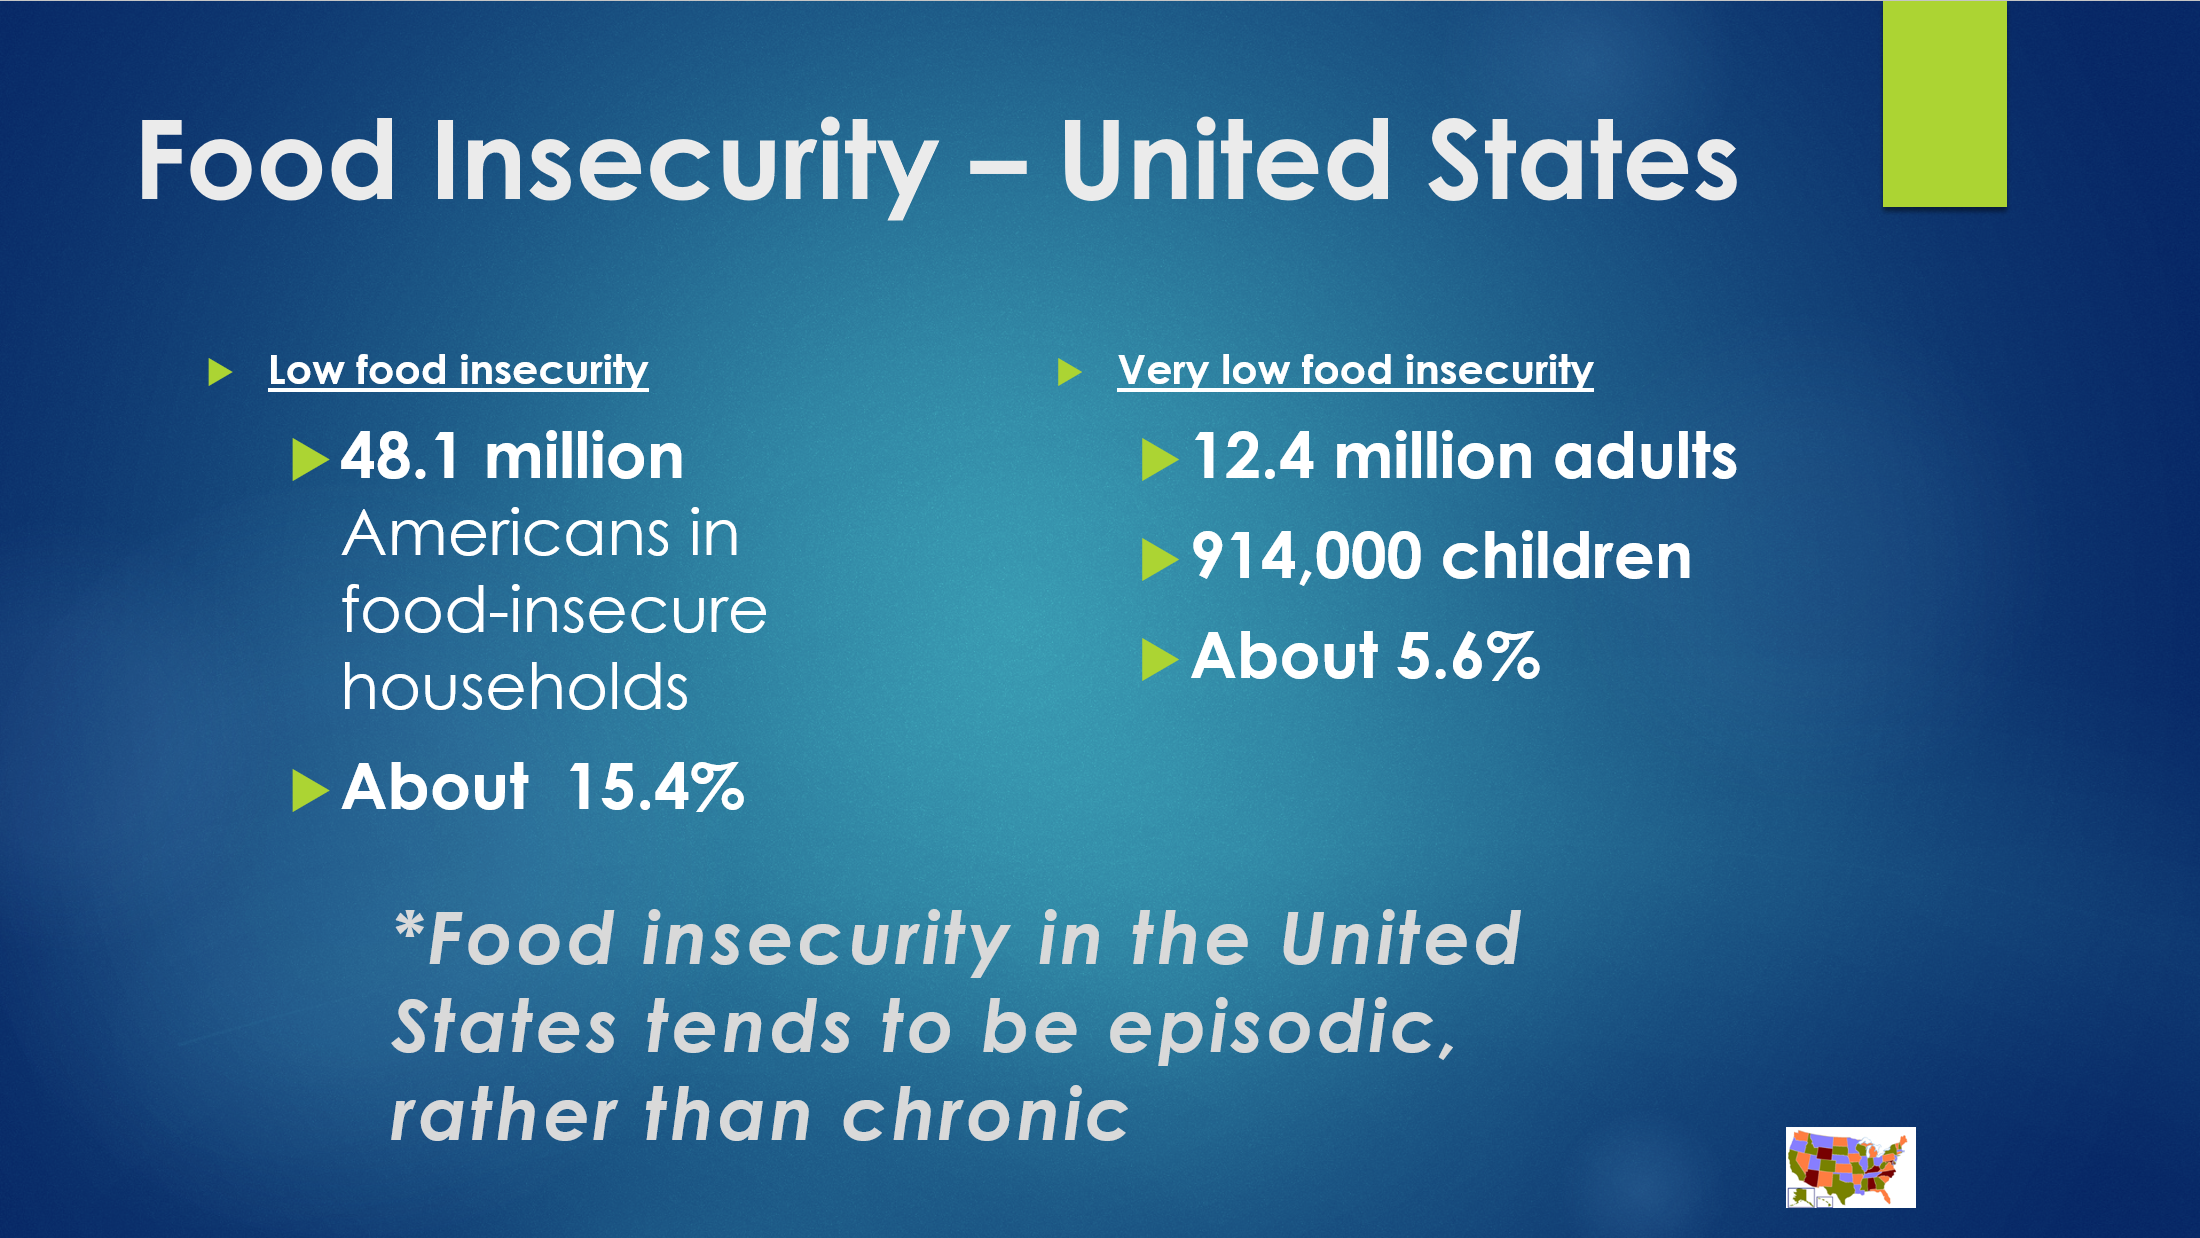
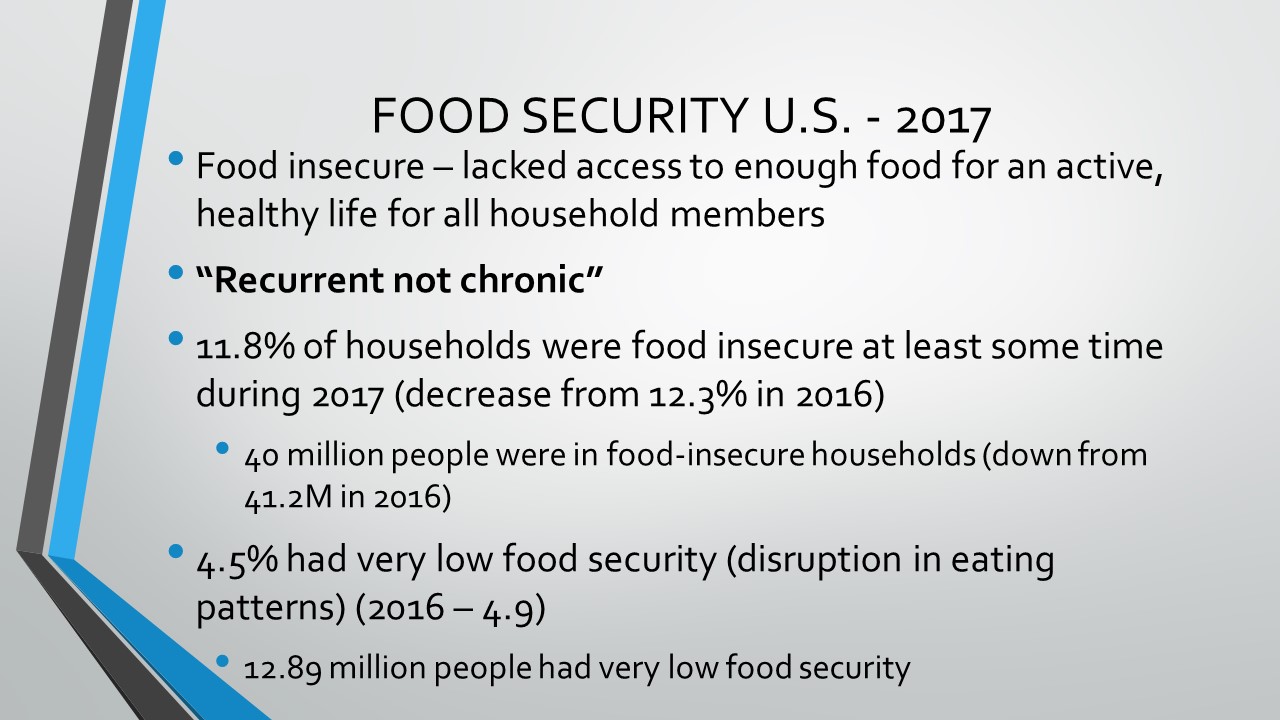
Turning to food security in the United States, we can see a slight decrease from 2016 to 2017. The USDA uses the term “food insecurity” instead of “hunger” to capture more accurately the situation for most people in the US. Food insecurity means that at some point during the year, a household lacked access to enough food for an active, healthy life for all household members. Chronic hunger, the kind we’ll get to when we turn to global hunger, is relatively rare in the US. The phrase the USDA uses is “recurrent not chronic,” which means that households experience periods of food insecurity throughout the year, but this is usually not persistent day-to-day. For many, periods of food insecurity come at the end of the month (when benefits run out) or during seasons when work is harder to come by.
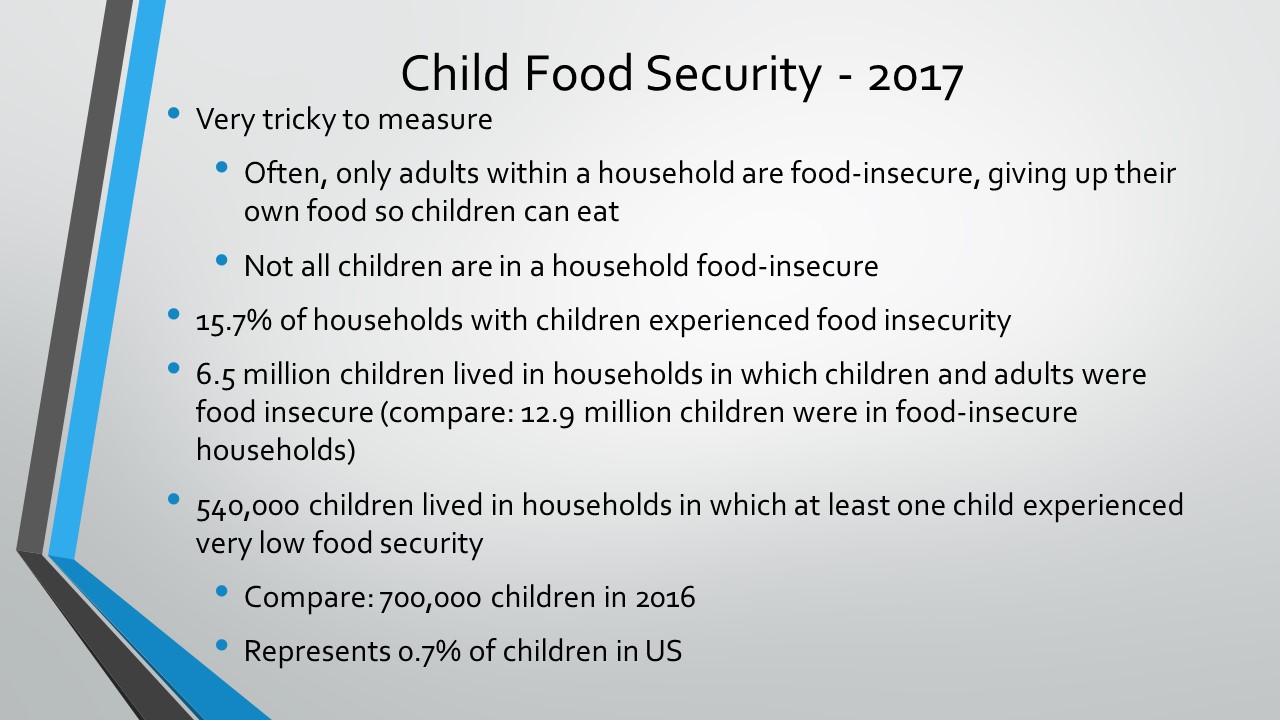
Child food insecurity in the US is really hard to measure for a couple reasons. First, children, especially young children, are usually the last people in a household to experience food insecurity. Often, adults or older children will give up their food to ensure the younger ones have enough to eat. There are also some programs specifically geared toward school-age children that can help, like the National School Breakfast and Lunch Programs. Because of the difficulty in measuring child food insecurity, the notes on the slide are carefully phrased. We can say how many children lived in households where children and adults faced food insecurity, though the data from the USDA don’t allow us to say for sure that every child in that household was food insecure.
Global Poverty
Source: World Bank

Source: World Bank
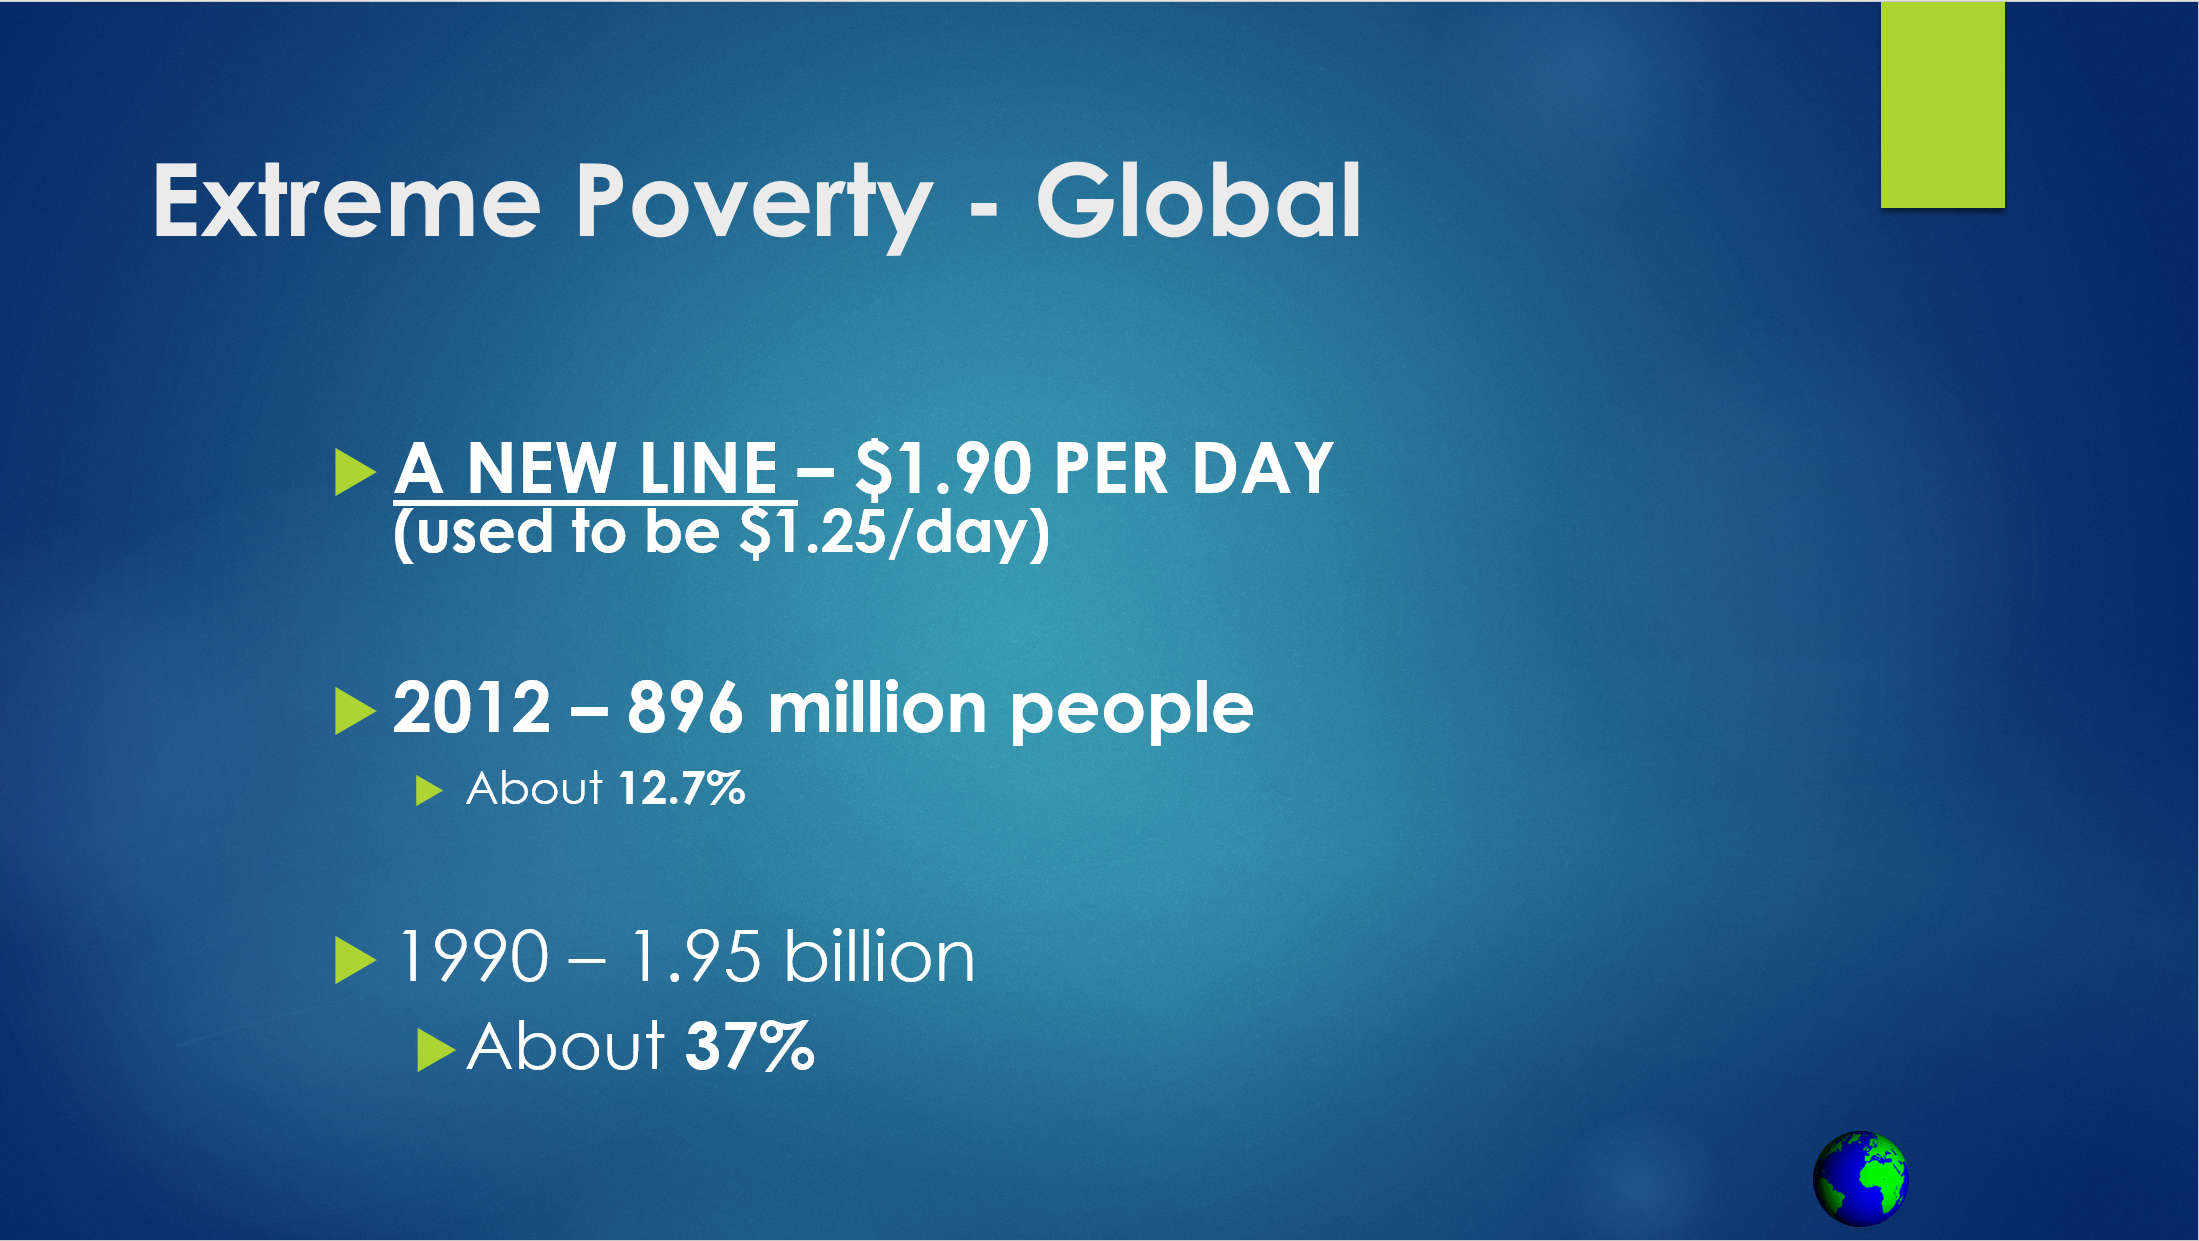
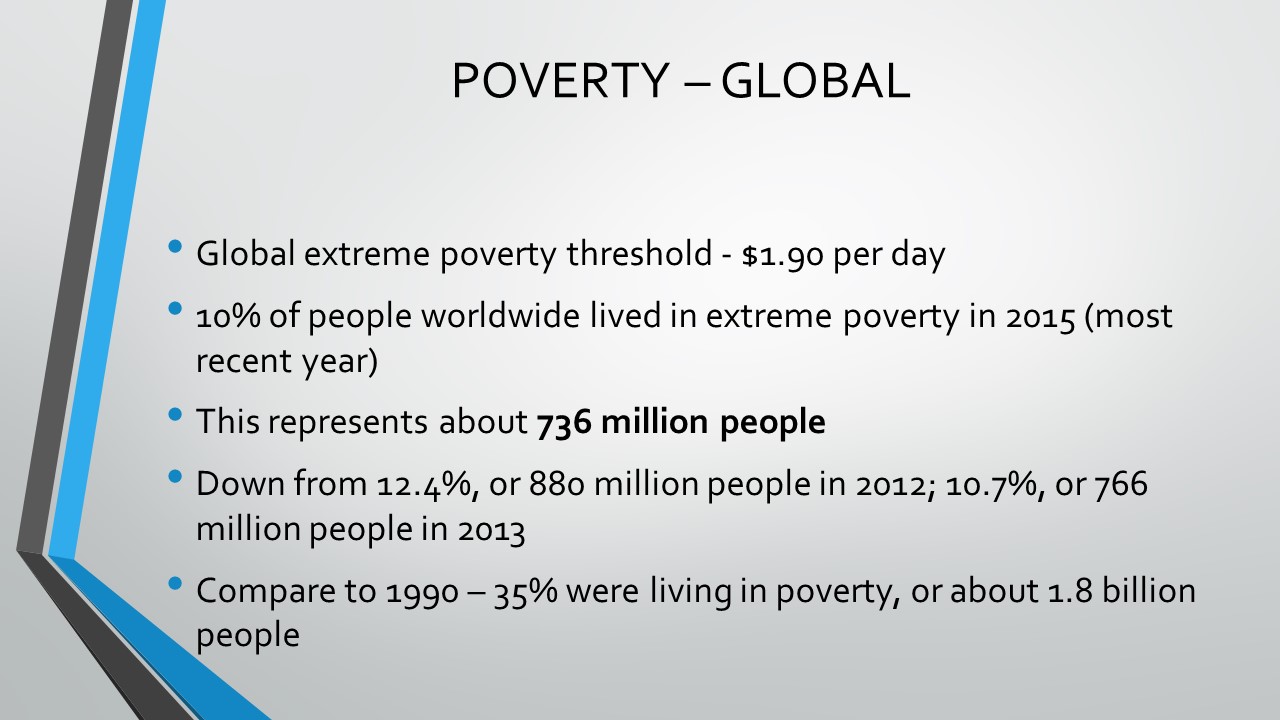
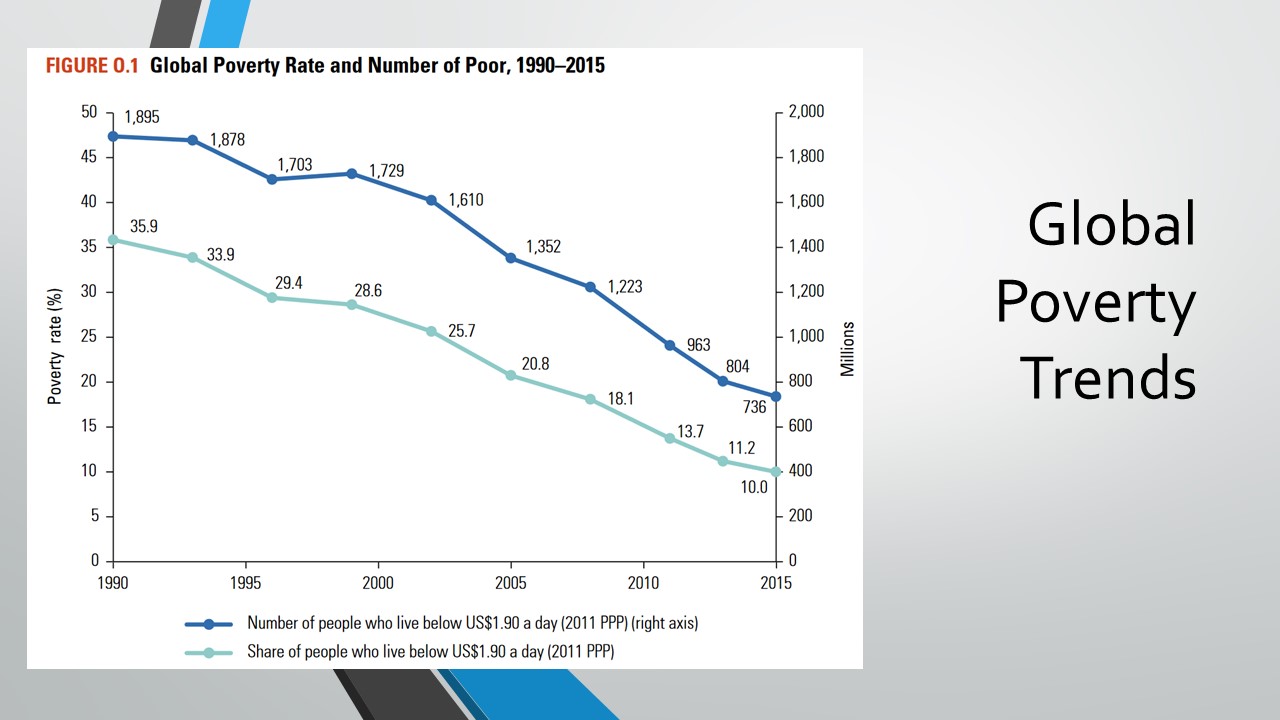
Global extreme poverty is defined as income below $1.90 per day. The numbers point to some tremendous progress since 1990, when about 35 percent of people worldwide were experiencing extreme poverty. The biggest contributor to this decline, according to the World Bank, has been economic growth, particularly in Asia. On the last slide above, you can see the poverty rate by region of the world shifting pretty drastically. In East Asia and the Pacific, the rate of poverty has gone from 60 percent in 1990 to less than 3 percent in 2015 (the most recent year.)
This has led the World Bank to conclude that “extreme poverty is increasingly becoming a Sub-Saharan African problem,” since Sub-Saharan Africa has the highest rates of extreme poverty and is the only region where poverty seems to be increasing.
This does tend to miss another trend in global poverty, though. Fewer and fewer people are living today in what might be called “low-income” countries. What this means is that there needs to be more of an emphasis on poverty within middle- and high-income countries. It also means that governments and organizations can no longer focus solely on “poor countries.” For the World Bank, this shift has signaled the need to measure poverty from a higher line, since participation in a labor market in a middle-income or high-income is more expensive than in a low-income country.
As an example, to get a job in a low-income country, a worker might only need food and clothing. In order to get a job in a middle-income or high-income country, however, the same worker might need internet access, a cell phone or transportation. For this reason, the World Bank has also started measuring poverty at $3.20 per day and $5.50 per day. At these lines, the global poverty rate jumps to 26.3 percent (at $3.20) and 46.0 percent (at $5.50 per day.) An important note: these lines have not replaced the $1.90 per day threshold by which global poverty is still currently measured.
Global Food Security
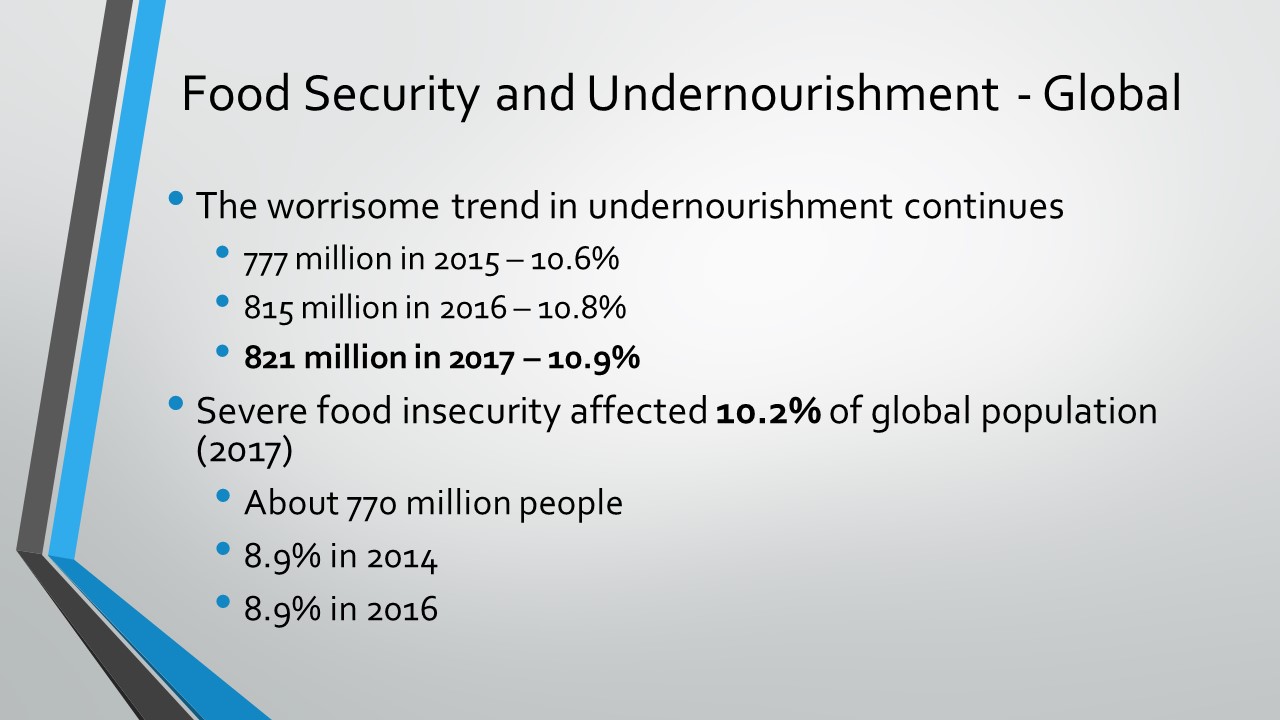
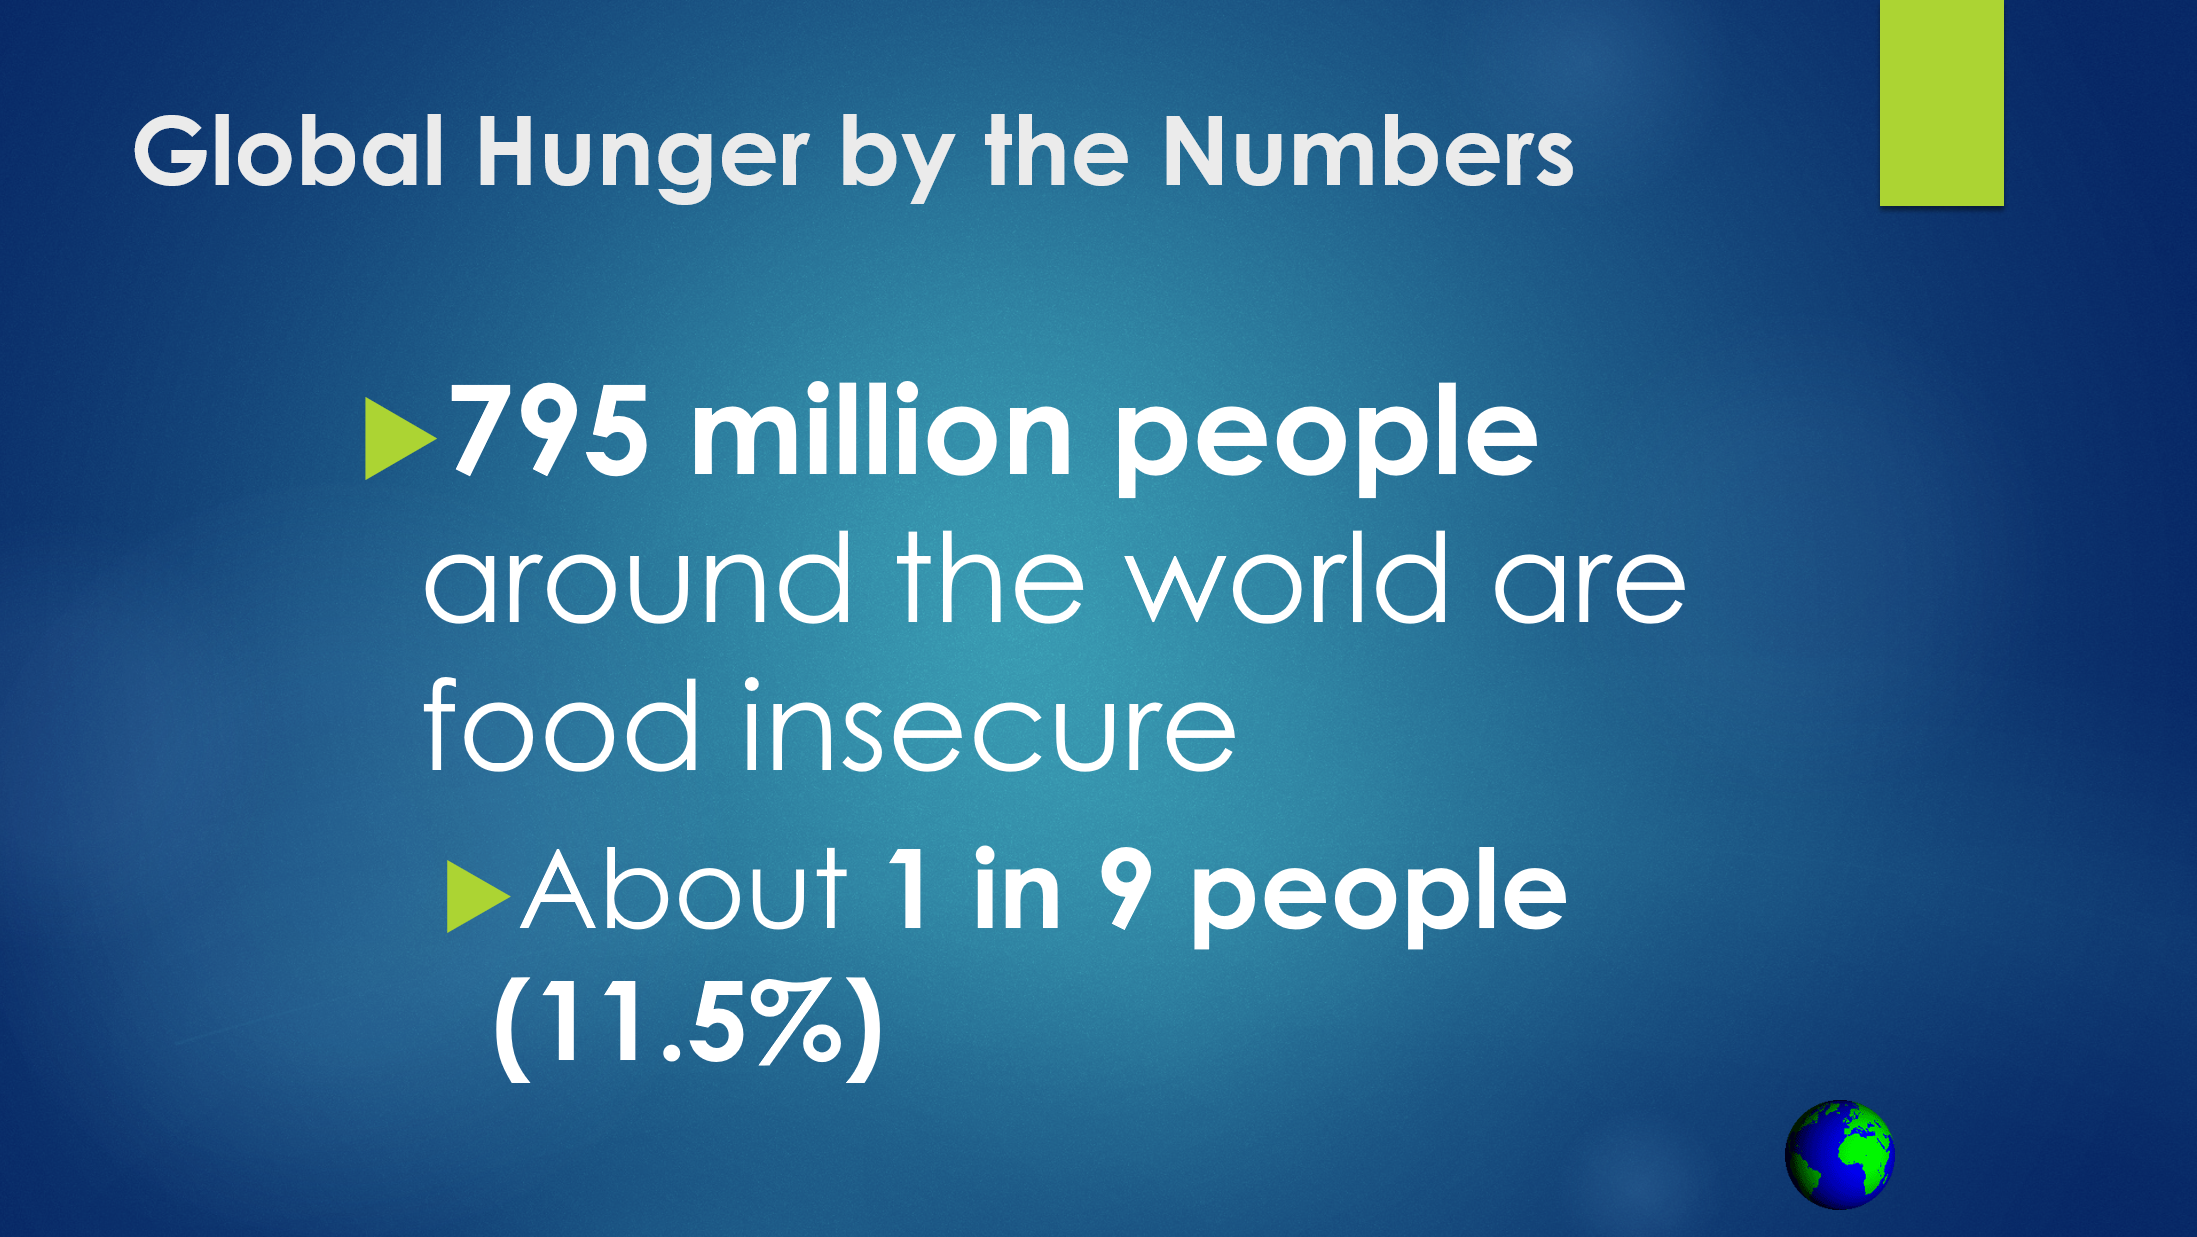
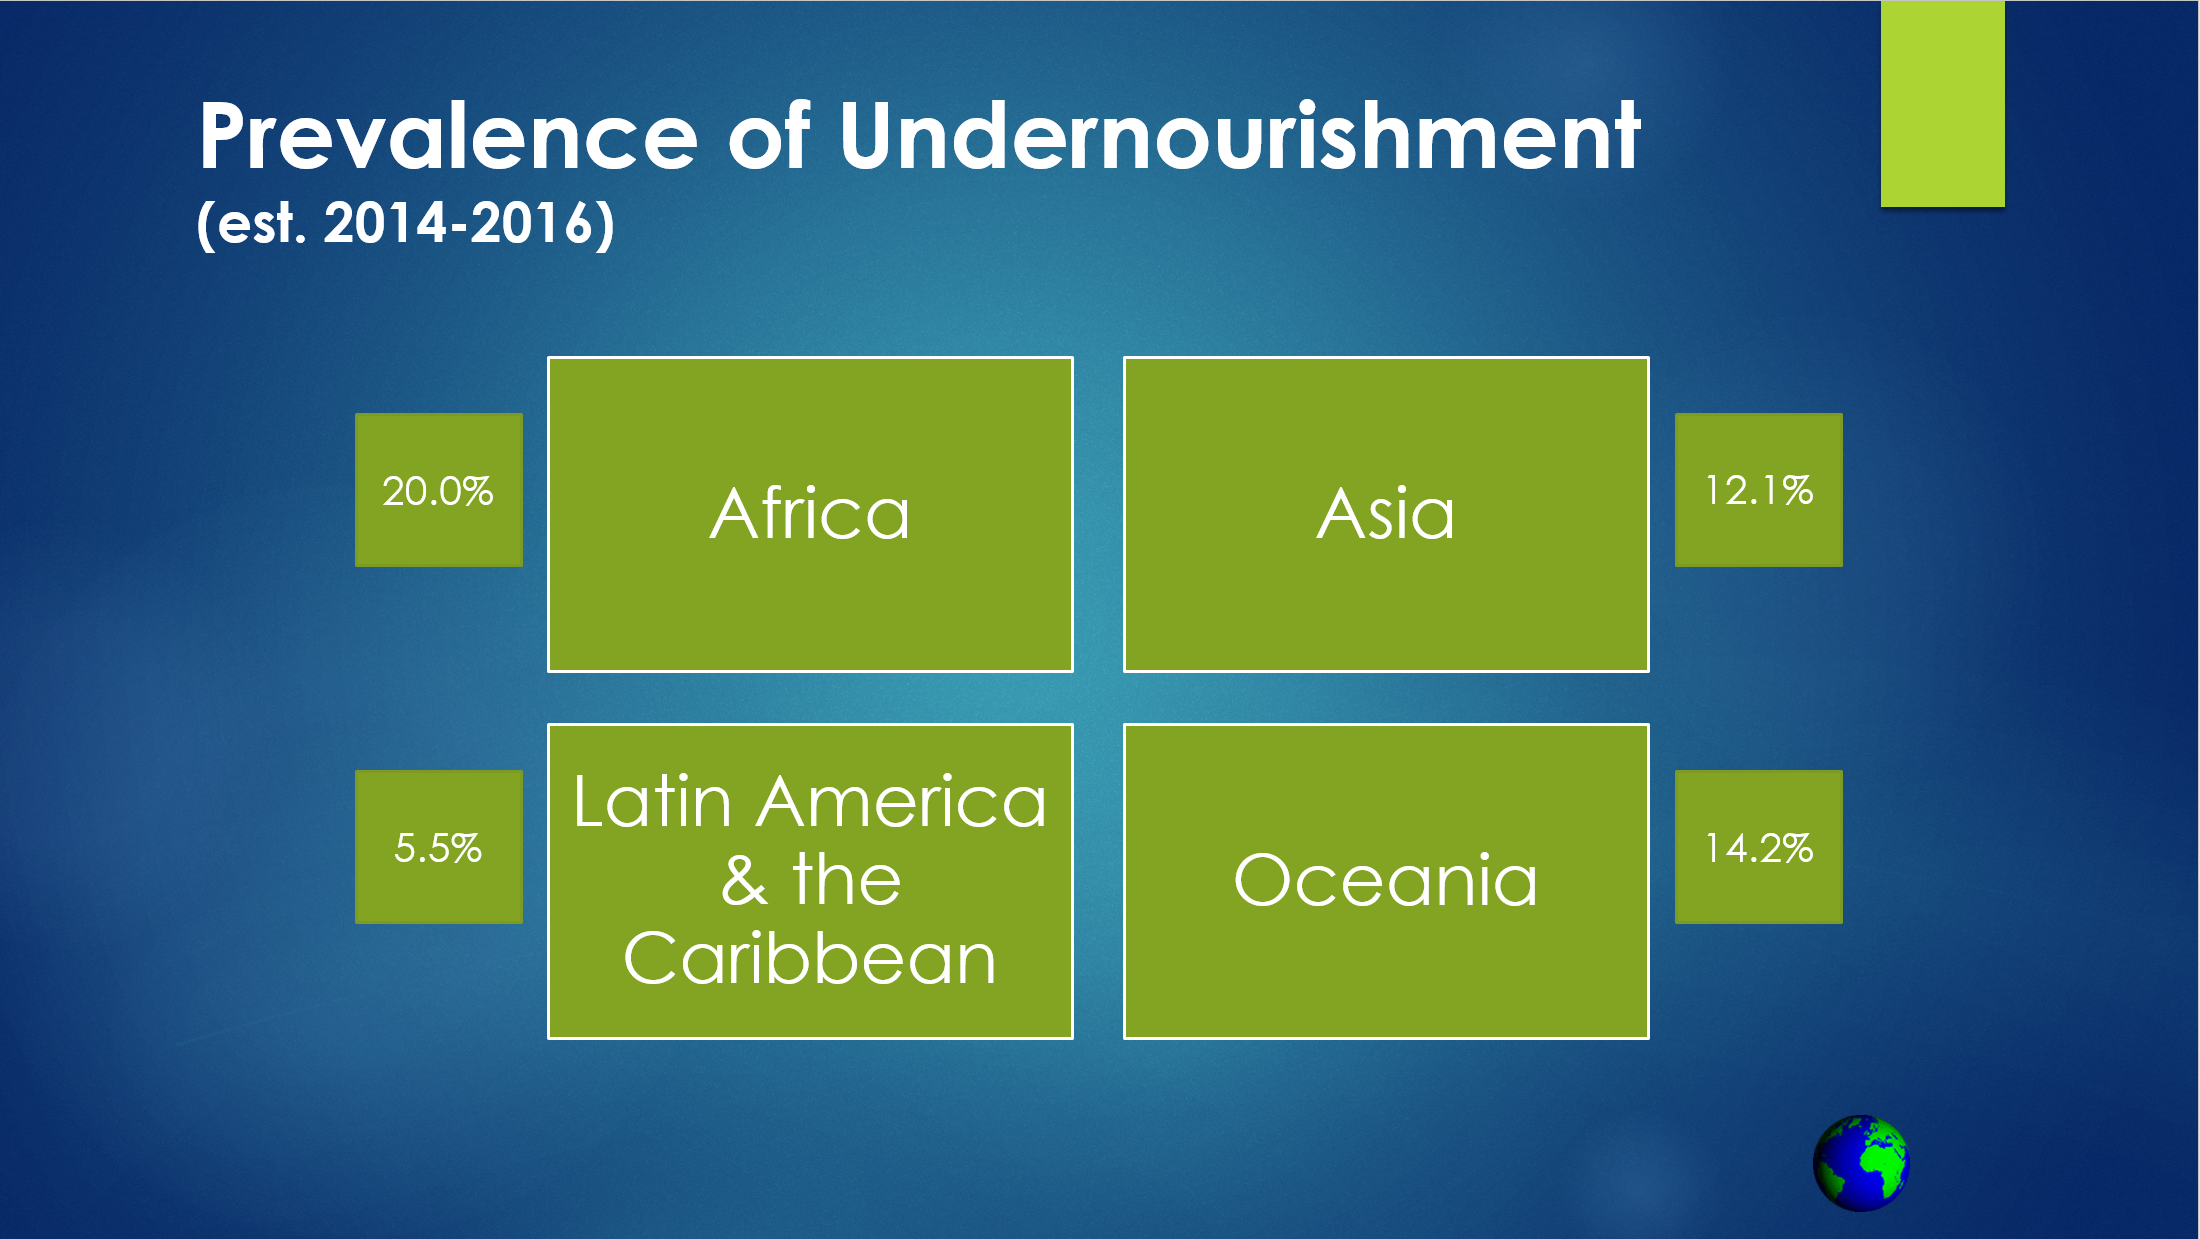
Global undernourishment is where we see some very concerning trends. After years of decline, we have seen a rise in global hunger over the last couple years, as the data show. The growth is slight – about 0.1 percent between 2016 and 2017 – it’s still a big shift after so much progress. There has been a much greater increase in severe hunger over the same time, from 8.9 percent in 2016 to 10.2 percent in 2017.
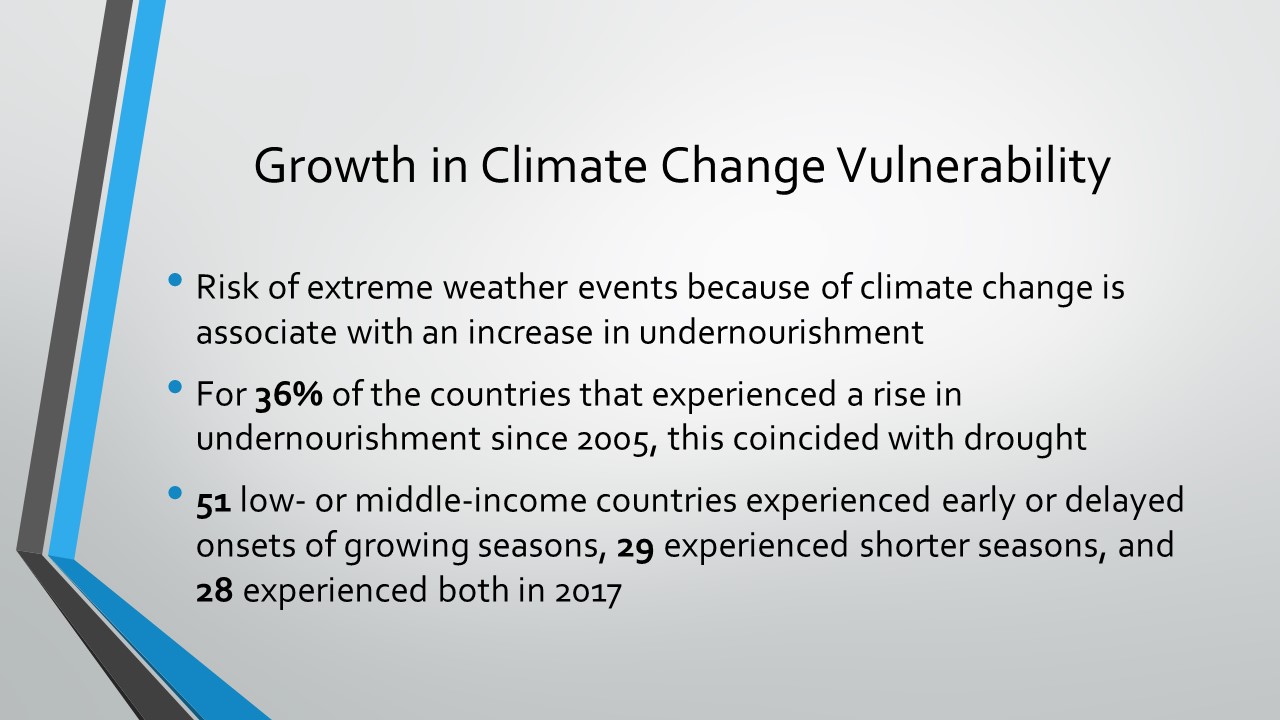
One of the biggest drivers of this, according to the Food and Agriculture Organization of the UN (FAO) is climate change.
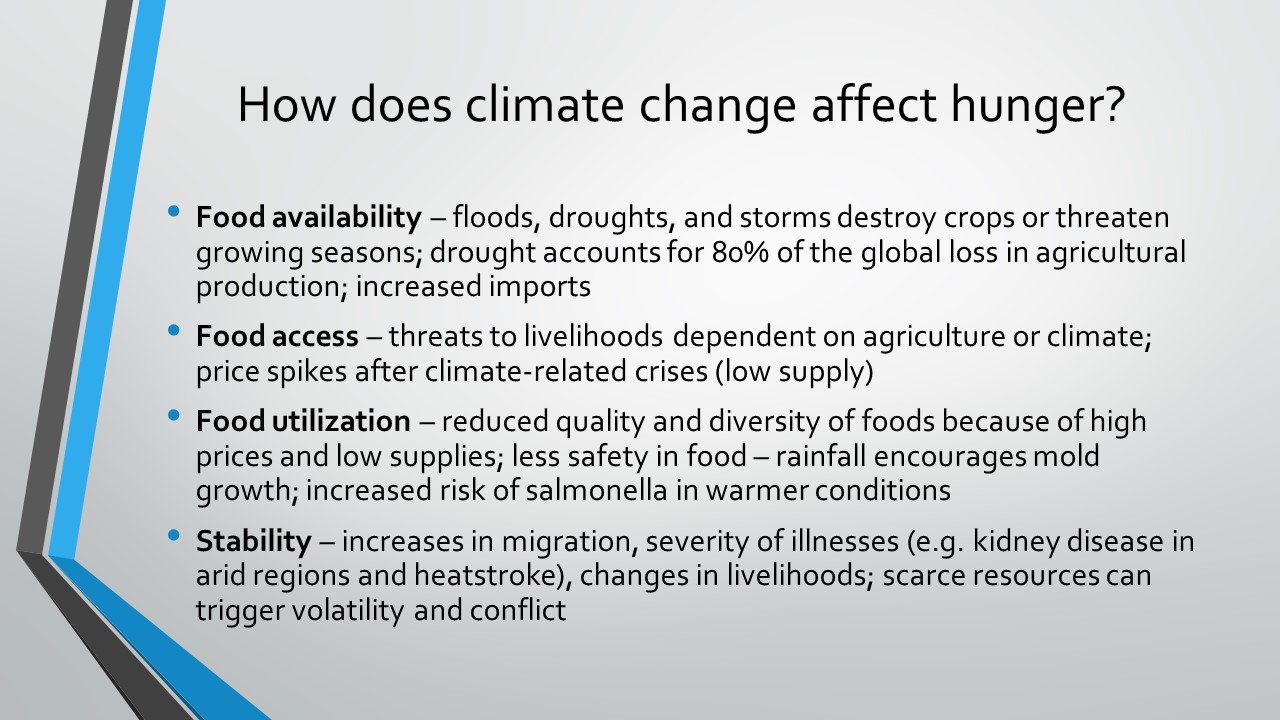
Climate change impacts hunger in several ways. The FAO discusses four of these. Climate change decreases:
- Food availability – When droughts and floods destroy crops, there is less food to harvest;
- Food access – When agricultural workers lose their jobs because of climactic changes, they cannot afford the little food that is available in the market;
- Food utilization – When supplies become low (see food availability), costs go up at the same time incomes of farmers are going down. Moreover, with floods and warmer weather, the conditions are ripe for increased growth of mold and bacteria;
- Stability – The health and welfare of people is deeply affected by the climate. A lack of water due to drought can exacerbate kidney problems and increase the risk of heatstroke. With a limited variety of foods available, the nutritional needs of children and adults may not be met. And when resources are scarce, people may feel the need to migrate to other areas (making them vulnerable to hunger) or conflict can erupt between communities competing for the same resources (again, making hunger more likely.)
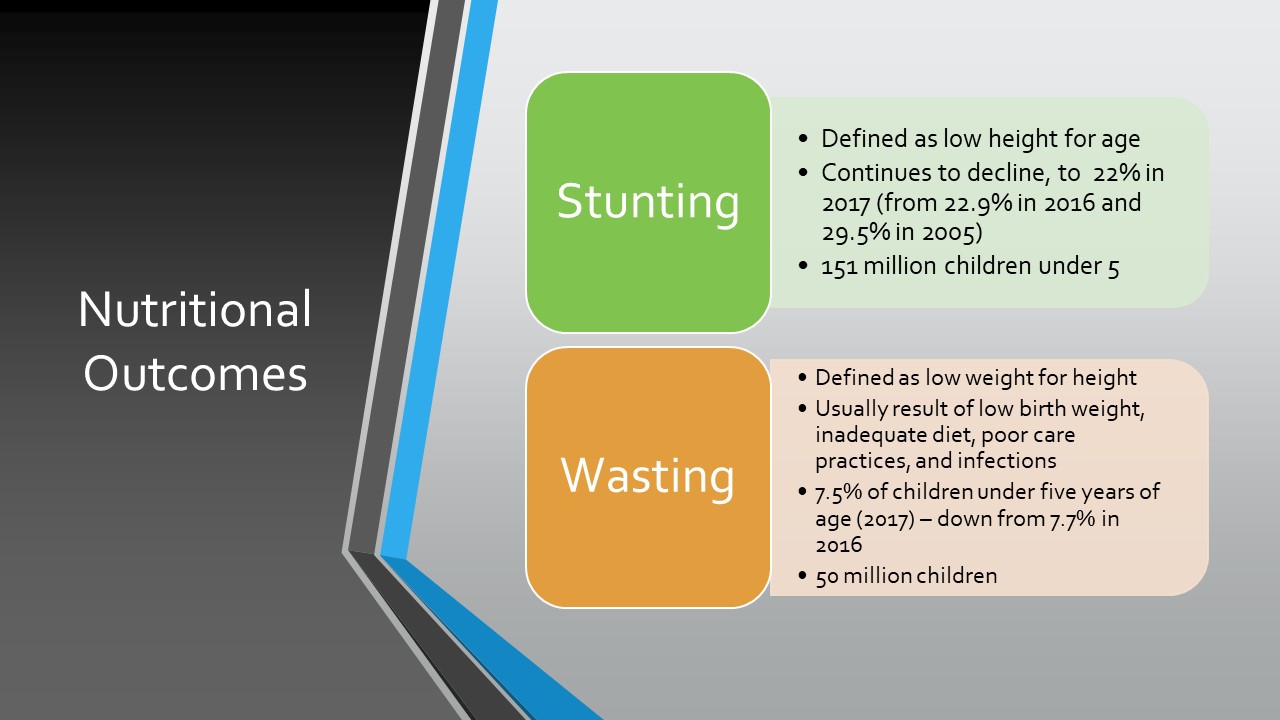
Finally, the FAO last year started measuring nutritional outcomes of wasting and stunting, which are defined on the slide. Stunting is more closely linked to long-term undernourishment, while wasting is more closely linked to immediate spikes in undernourishment, so they are a bit different. Both are serious outcomes, though, and can indicate immediate and future needs for children who are undernourished.
Together, the statistics point to some good news, like the continued decrease in poverty both worldwide and in the US, and some challenging news, like the rise in global hunger and the millions of children still affected by stunting or wasting. But the main message to take away from this is that great progress can and has been made over the years against poverty and hunger. Now, there is a need to re-focus energies and attention to continue this progress and, especially, to prevent the rise in global hunger from continuing.
Follow this link to download the full PowerPoint presentation.
Thank you for all that we do together to respond to poverty and hunger in our world!
If you have any questions about the data presented here, please contact Ryan Cumming, program director for hunger education with ELCA World Hunger, at Ryan.Cumming@ELCA.org.