Skip to content

ELCA Blogs

New Data Available: Hunger and Poverty by the Numbers for 2020


Knowing the numbers for hunger and poverty can go a long way to helping us talk about the issues accurately and craft effective, forward-looking responses. For those who share with their congregation information about hunger and poverty, these numbers can also be helpful in putting together presentations or workshops.Below, we have compiled the data from the most reliable sources we have for official numbers on poverty and hunger in the United States and around the world. You can download the slides to put directly into a presentation or use the numbers in your communications and work. You can also download the entire Power Point presentation at the link at the end.

Of course, we know with the COVID-19 pandemic that many of these numbers are already out-of-date. We have some estimates of how the pandemic is impacting hunger and poverty, but no solid data has yet been published. At the end of this post, we’ll go over what we know so far about COVID’s impact. (To no one’s surprise, it’s not good.)

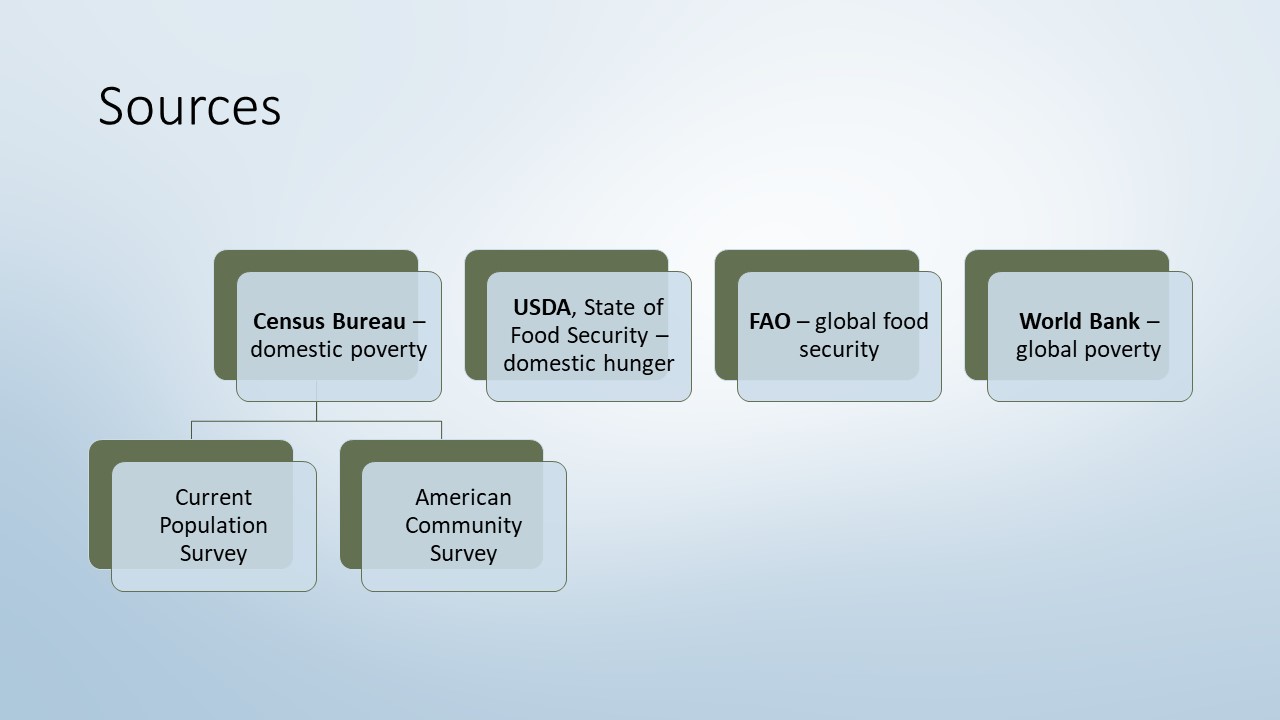
ELCA World Hunger relies on several sources for data:

*One important note before we get started is that data are always for previous years. Below, we’ve indicated what years are being measured by the data. These are the most up-to-date statistics available from the sources. All statistics, graphs and charts come from the respective sources listed above.
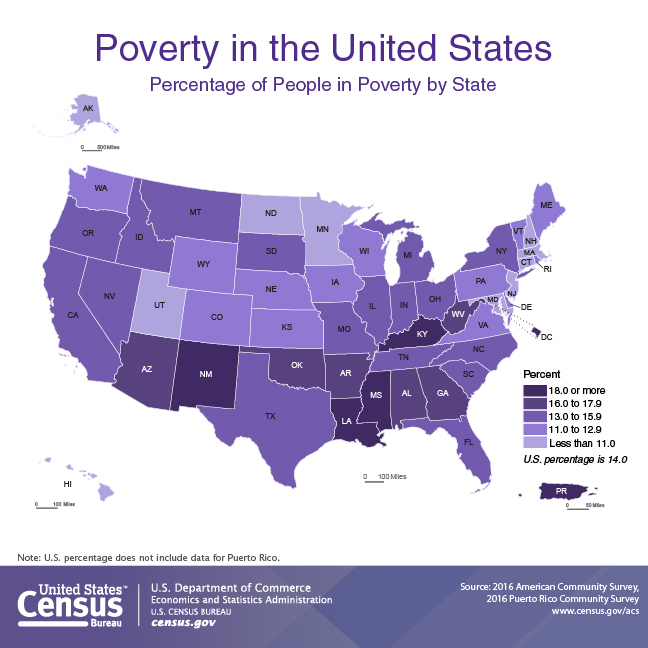
U.S. Poverty

We’ll start off with data about the United States. Here are the thresholds used to measure poverty in 2019:

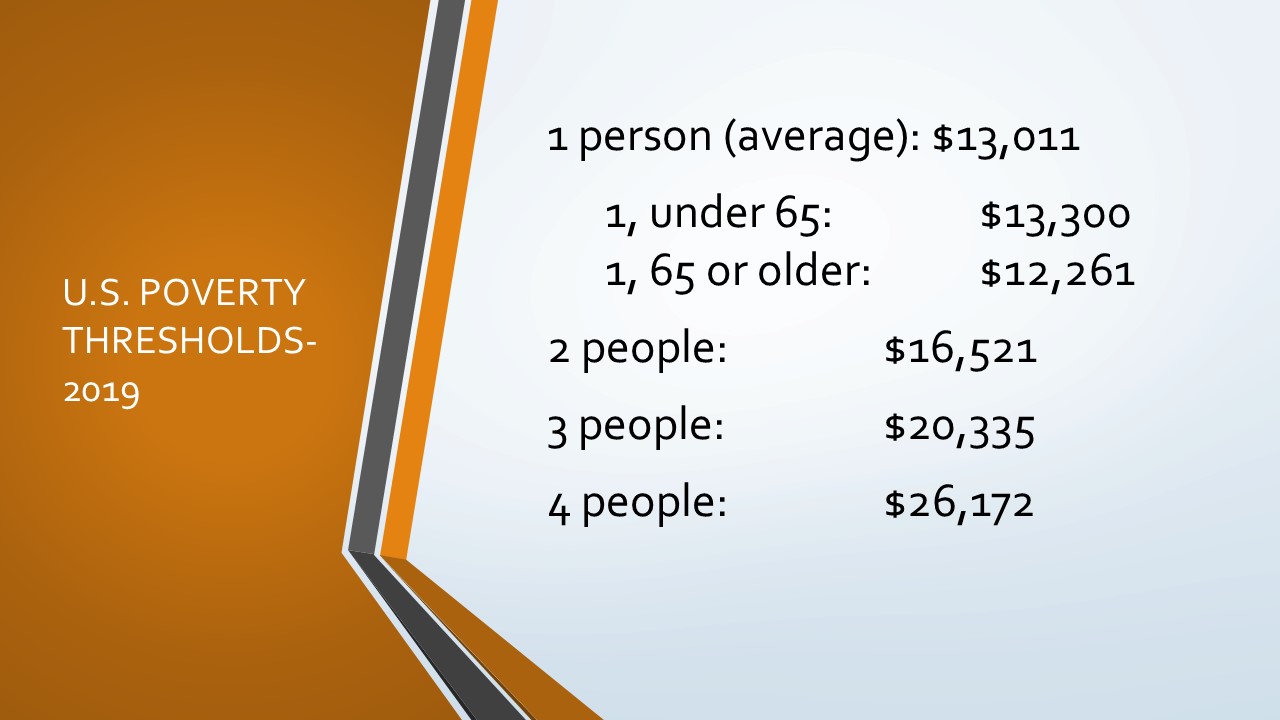
The poverty thresholds are reported here as averages for households by number of people. The Census Bureau takes into account the age of householders and the number of children to determine the threshold. So, for example, for a household of four, the average poverty threshold is $26,172. The range, though, is $26,017-26,370, depending on the characteristics of the household. You can see another example in the slide under the household of a single person.

Another important point here is that the poverty thresholds differ from the poverty guidelines. The guidelines are used to determine eligibility for certain government programs, like the Supplemental Nutrition Assistance Program (SNAP; formerly food stamps). The guidelines don’t vary based on age or number of children. The thresholds are used to measure poverty. The thresholds are based on three times the cost of a minimum food diet in 1963, adjusted for inflation.

To be considered “in poverty” in the US, a household’s income must be below the threshold.

To be considered eligible for some government assistance programs, a household’s income must be below (or below a certain multiple) of the poverty guideline.

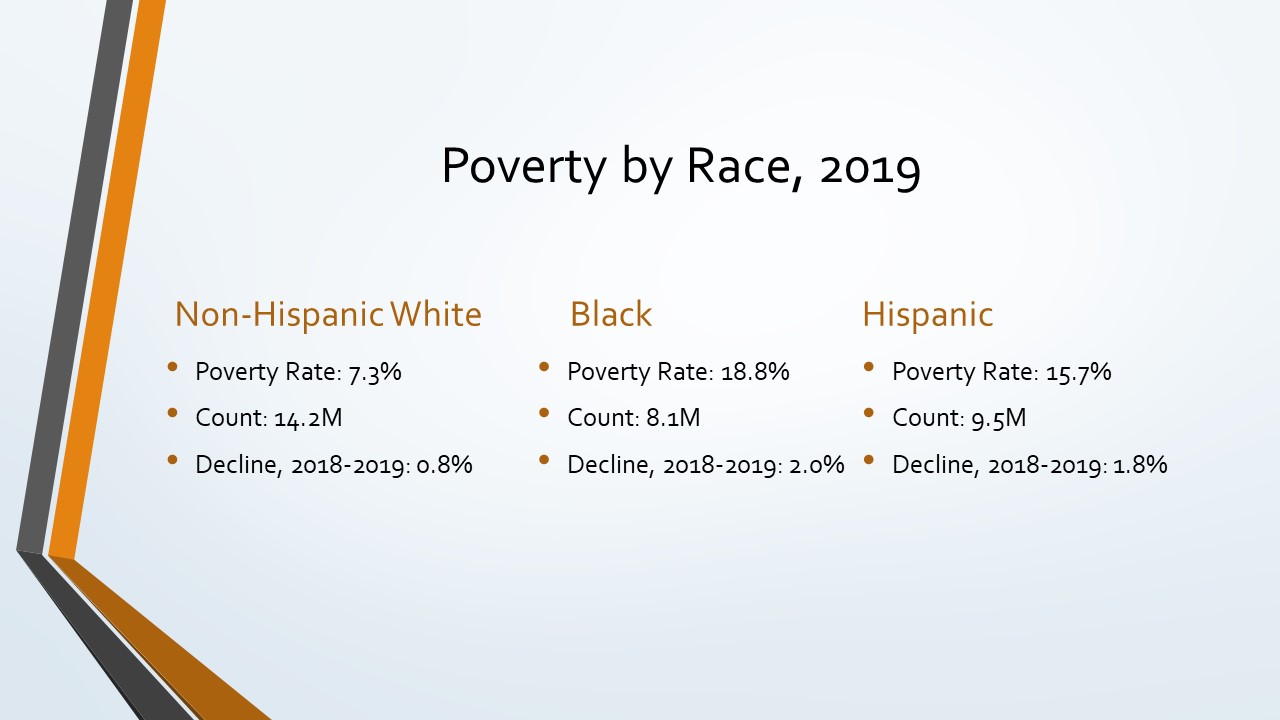
One of the ongoing concerns in the US is racial disparities in poverty (as a note, these categories are the identifiers used by the US Census Bureau):

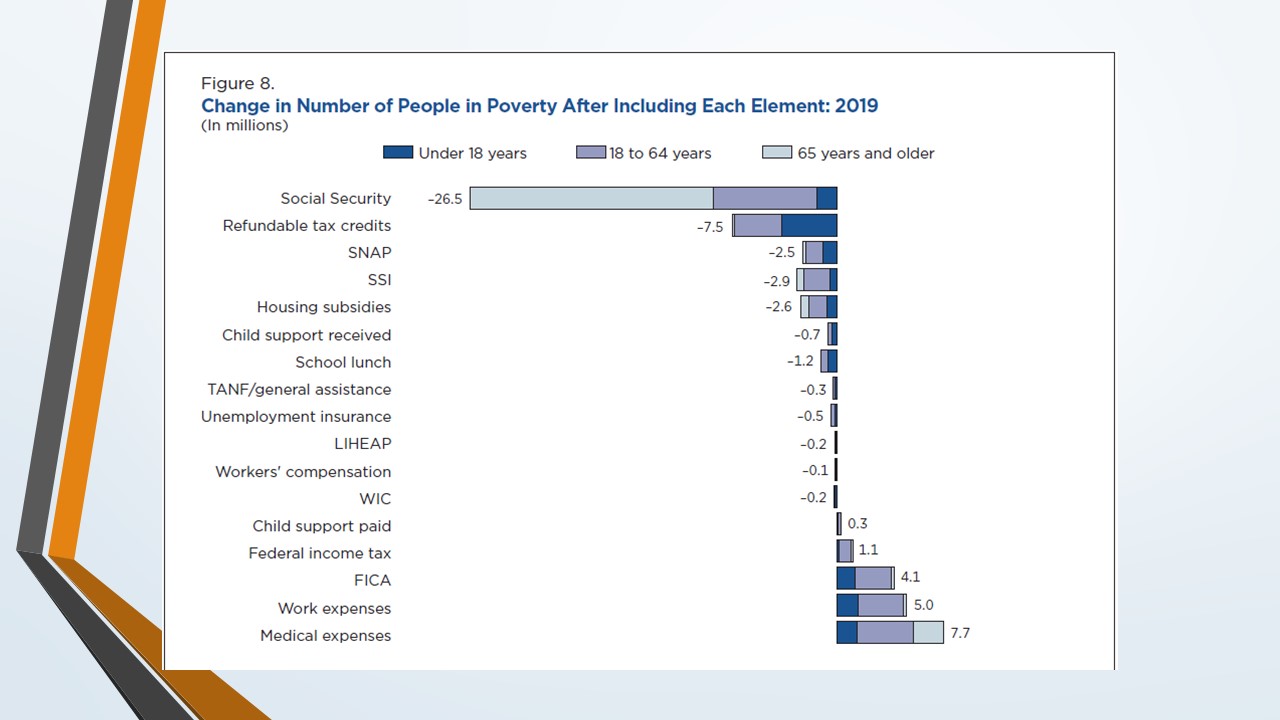
In addition to the official poverty measure, the US Census Bureau also calculates a Supplemental Poverty Measure (SPM.) You can read more about the differences here, but one of the interesting things the SPM lets us see is how certain safety net programs and benefits help alleviate poverty. It also allows us to estimate how much certain costs contribute to poverty. In the chart below, we can track the change in the number of people in poverty when each element individually is included. For example, we can see in the chart that SNAP (the Supplemental Nutrition Assistance Program) helped keep about 2.5 million people out of poverty in 2019.

U.S. Food Security

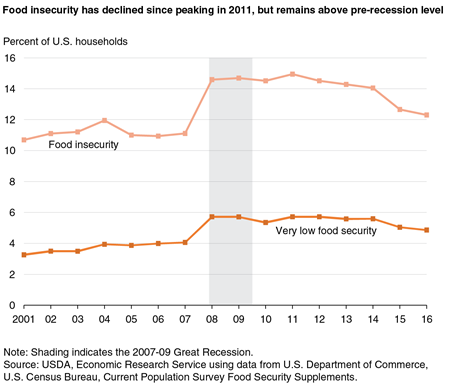
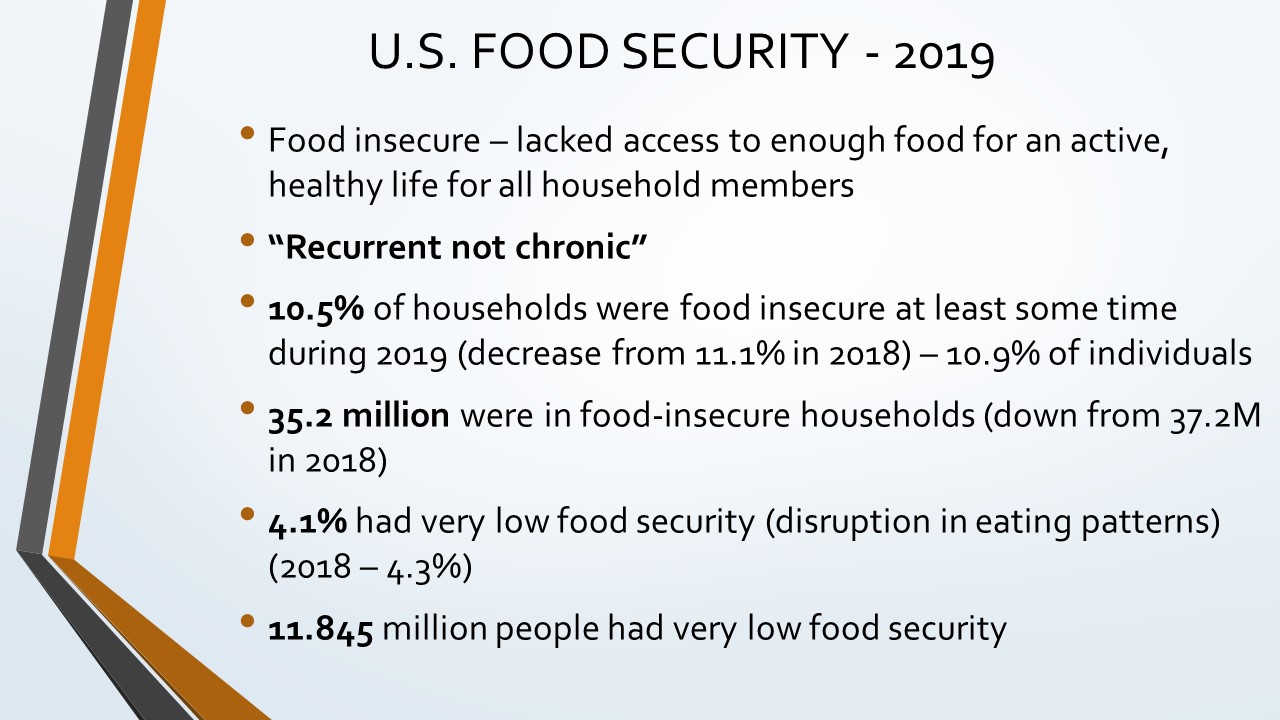
Turning to food security in the United States, we can see a slight decrease from 2018 to 2019. The USDA uses the term “food insecurity” instead of “hunger” to capture more accurately the situation for most people in the US. Food insecurity means that at some point during the year, a household lacked access to enough food for an active, healthy life for all household members. Chronic hunger, the kind we’ll get to when we turn to global hunger, is relatively rare in the US. The phrase the USDA uses is “recurrent not chronic,” which means that households experience periods of food insecurity throughout the year, but this is usually not persistent day-to-day. For many, periods of food insecurity come at the end of the month (when benefits run out) or during seasons when work is harder to come by.

In the US in 2019, almost 11% of individuals were food-insecure. This is about 35.2 million people.


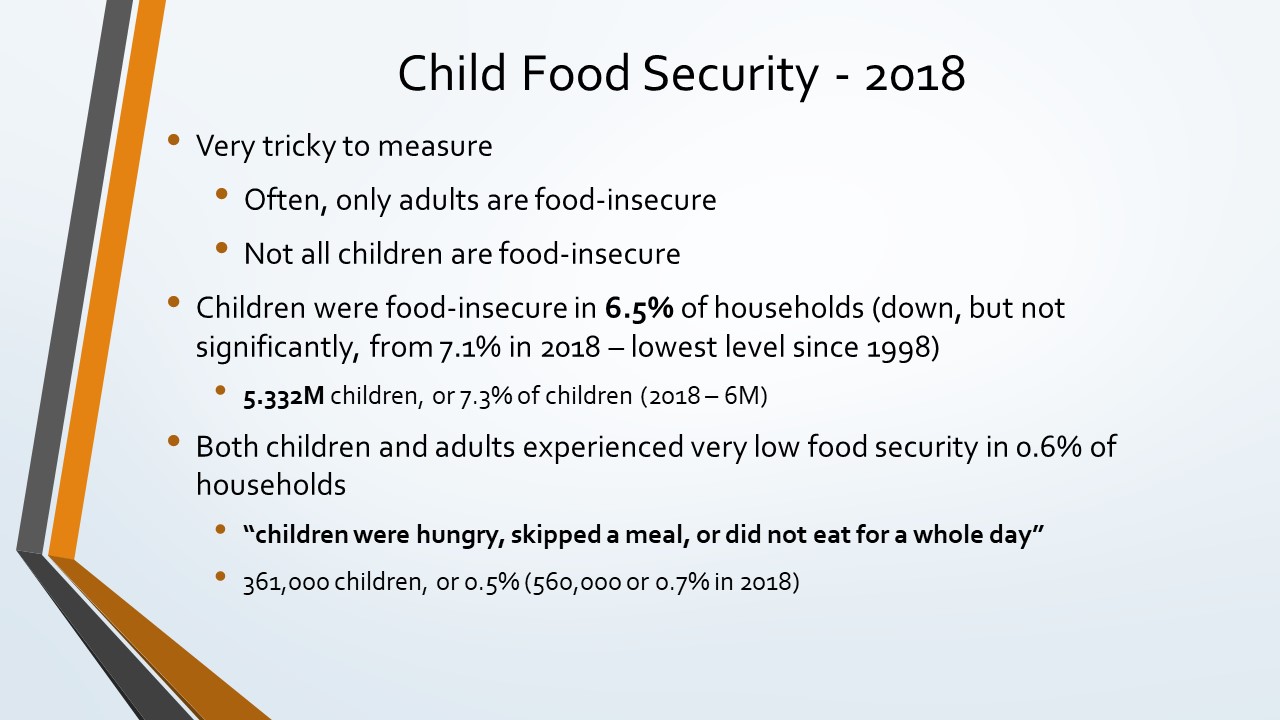
Child food insecurity in the US is really hard to measure for a couple reasons. First, children, especially young children, are usually the last people in a household to experience food insecurity. Often, adults or older children will give up their food to ensure the younger ones have enough to eat. There are also some programs specifically geared toward school-age children that can help, like the National School Breakfast and Lunch Programs. Because of the difficulty in measuring child food insecurity, the notes on the slide are carefully phrased. We can say how many children lived in households where children and adults faced food insecurity, though the data from the USDA don’t allow us to say for sure that every child in that household was food insecure.

The situation for people facing very low food security in the US is concerning. Of the 5.3 million households reporting very low food security,

  • 48 percent said that an adult in the household lost weight because they couldn’t afford food;
  • 36 percent said that an adult did not eat for a whole day because there wasn’t enough money for food; and
  • 97 percent said that an adult had reduced the amount of food they ate because they couldn’t afford sufficient food for every household member.

Global Poverty

Global extreme poverty is defined as income below $1.90 per day. The numbers point to some tremendous progress since 1990, when about 35 percent of people worldwide were experiencing extreme poverty. The biggest contributor to this decline, according to the World Bank, has been economic growth, particularly in Asia.

This does tend to miss another trend in global poverty, though. Fewer and fewer people are living today in what might be called “low-income” countries. What this means is that there needs to be more of an emphasis on poverty within middle- and high-income countries. Because of this, the World Bank has started measuring poverty at higher levels, since participation in a labor market in a middle-income or high-income is more expensive than in a low-income country. The general decline in the graphs also doesn’t clearly show that progress against poverty worldwide has been slowing in the last few years. Keeping the decline from leveling out will take more investment and more concerted, coordinated efforts.

Global Hunger

While poverty has declined, the same can’t be said for hunger. (We’ll get to how COVID-19 has made this even more troublesome later.)  The most recent data we have is from 2019, so this doesn’t include the impact of the pandemic yet.

The rate of undernourishment globally has remained pretty stable since 2014. Before then, the world made some good progress, bringing the rate of undernourishment down from over 12% in 2005 to less than 9% in 2014. But in the last 5 years, the rate has crept up from 8.6% to 8.9%, or about 687.8 million people.

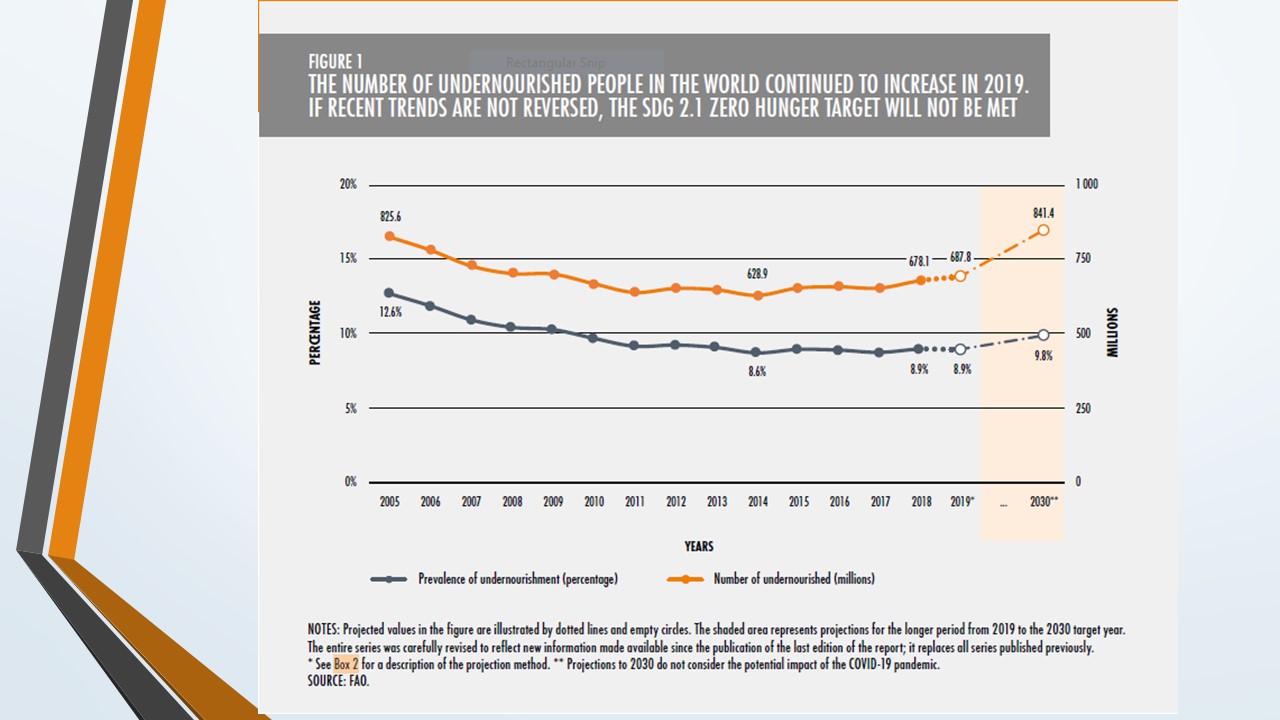
This slowed progress means, sadly, that we are no longer on track to meet the UN’s Sustainable Development Goal of ending hunger.

The next slide shows some of the key drivers of hunger and poverty around the world. Some of the biggest causes are conflict and climate change. Climate change, for instance, is expected to drive 68-132 million people into poverty over the next ten years. (See this earlier post for a discussion of some of the ways climate change causes hunger.)

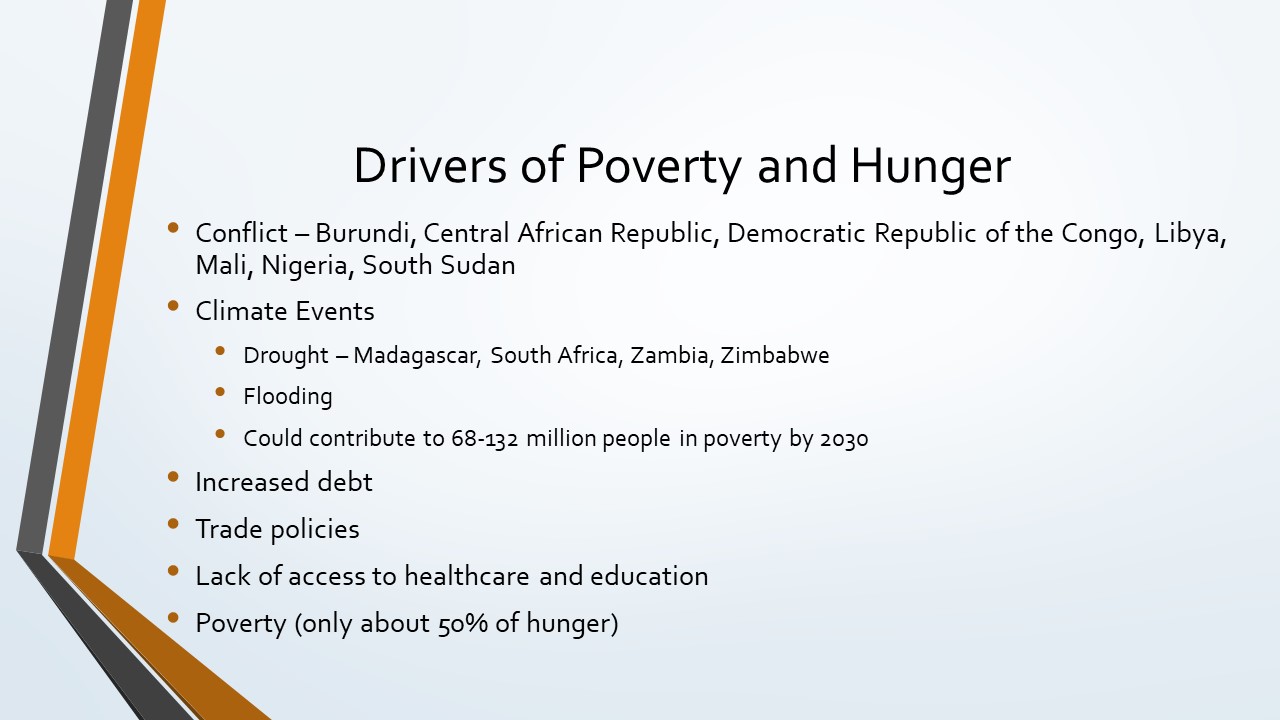
One of the interesting things the World Bank found in its research is the complexity of vulnerability to climate events. People living in poverty are not necessarily more likely to experience major climate events, but they are less likely to have the resources needed for resilience. They are more likely to have lower quality housing, more likely to be dependent on fragile infrastructure (such as unpaved roads), more vulnerable to food price increases, more dependent on agriculture and so on. So, people in poverty will not necessarily experience more climate events, but they will be more vulnerable to the short- and long-term consequences of them.

Just one note here on trade policies. Policies that protect local producers are important to ensure a fair marketplace. But these policies also tend to protect crops such as cereals and grains. This can lead to a dearth of affordable nutrient-rich vegetables, fruits and higher-quality starches. Remember, undernourishment is not just about how many calories we consume but what kinds of calories we can access. Trade policies can play a critical role in this, both for the better and the worse.

COVID-19 Impacts

Global Impacts

There is no way of sugar-coating this. COVID-19 is causing hunger and poverty to rise at an incredible pace. The problem isn’t just how many people are affected but how quickly we were affected and how many industries were impacted.

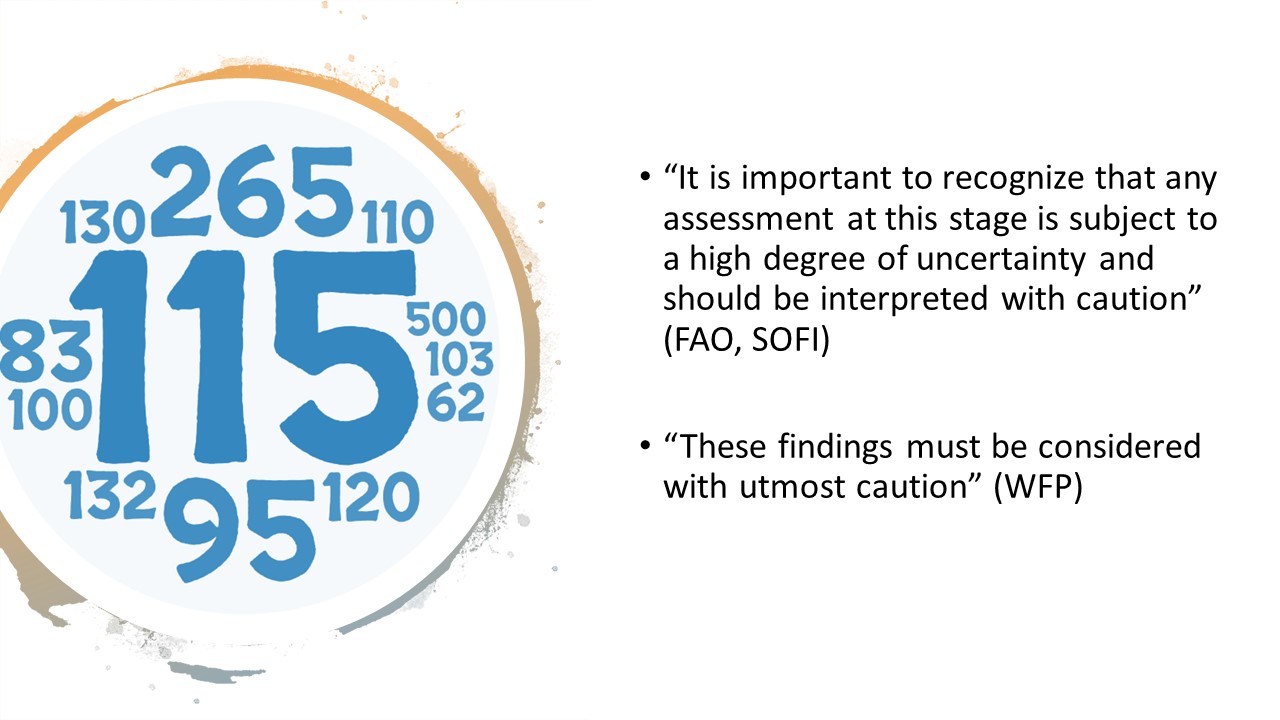
One thing to remember is that these are estimates. We have not yet received reliable numbers, so these are projections. They’re very solid projections, but they are still just projections. Another thing to keep in mind is that, while news media may report these estimates under the collective term “hunger,” the organizations creating these estimates aren’t always talking about the same thing. There have also been big problems with collecting data, obviously.

Let’s start with how COVID-19 impacts hunger. There are four big categories of impacts.

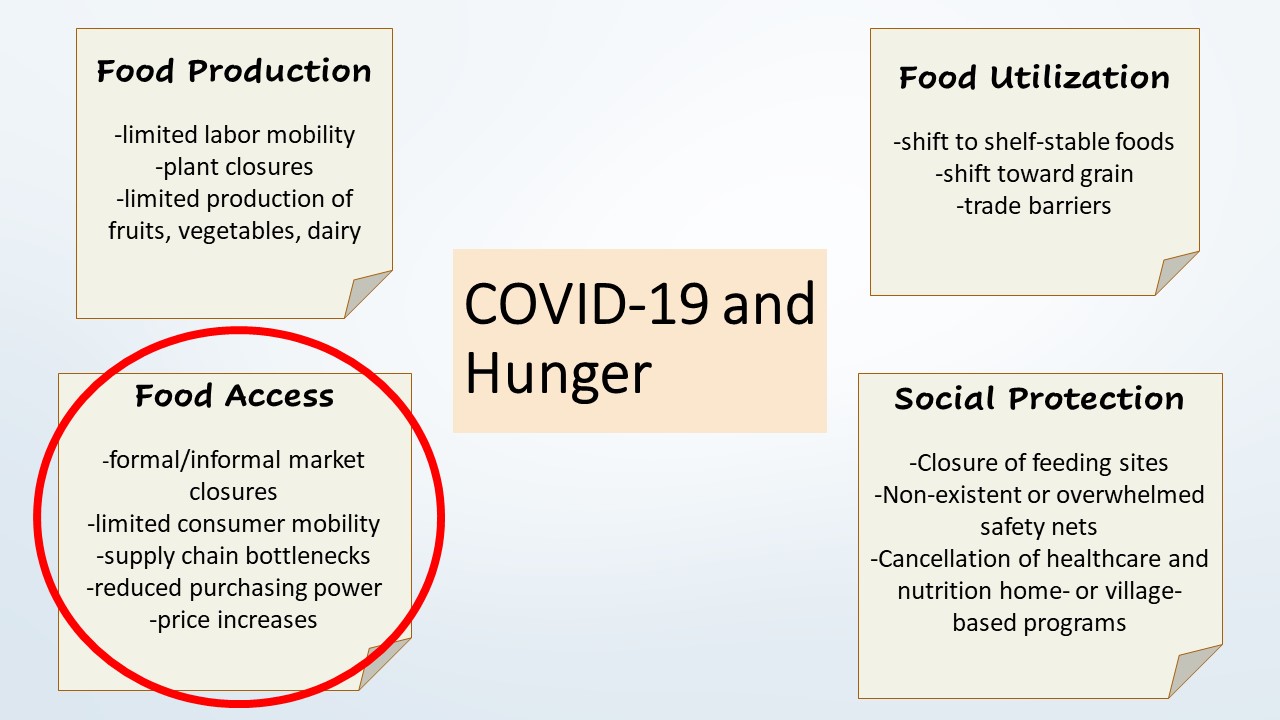
First, food production. Agriculture and food processing require a lot of human labor. With limited mobility, workers aren’t able to get to work. If they get sick, they can’t work. Plants may shut down, too, so there is a shortage of pathways for getting food from farms to tables and stores. The International Food Policy Research Institute notes that people in poverty are most affected in this category because they are dependent on their labor for income. When they can’t work, they don’t get paid.

Next, food utilization. This has eased a bit over the last year, but with trade barriers in place to prevent the spread of COVID, countries that are dependent on exports from other countries can’t get the food they need for markets. With hoarding of food, there is also a shift toward shelf-stable goods, which are not always the healthiest.

Third is food access, and this is the category that is hardest hit. Markets have closed, we’ve seen supply chain bottlenecks, and consumers have less money to spend. We saw this in the US last year, when processing plant closures led to bottlenecks that created shortages of chicken and beef in stores. There was plenty of meat being produced, but it couldn’t get to markets where we could buy it. We’ve also seen some concerning increases in food prices over the last year. That’s good for some farmers, but not great news for most folks around the world, whose income leaves them very sensitive to changes in food prices.

Last, social protection. As of last Fall, 73 countries had postponed elections or referendums, which makes them socially vulnerable. Also, many countries lack robust social safety nets, so there aren’t protections to help people weather the economic risks of the pandemic. And, of course, the pandemic has closed feeding sites and has forced healthcare programs to shift from nutrition and other priorities to COVID response. We have to remember that even as we deal with COVID, problems like waterborne illnesses, HIV/AIDS, and malaria are still significant issues.

The economic impact is expected to be severe, though it won’t be equally felt by everyone.

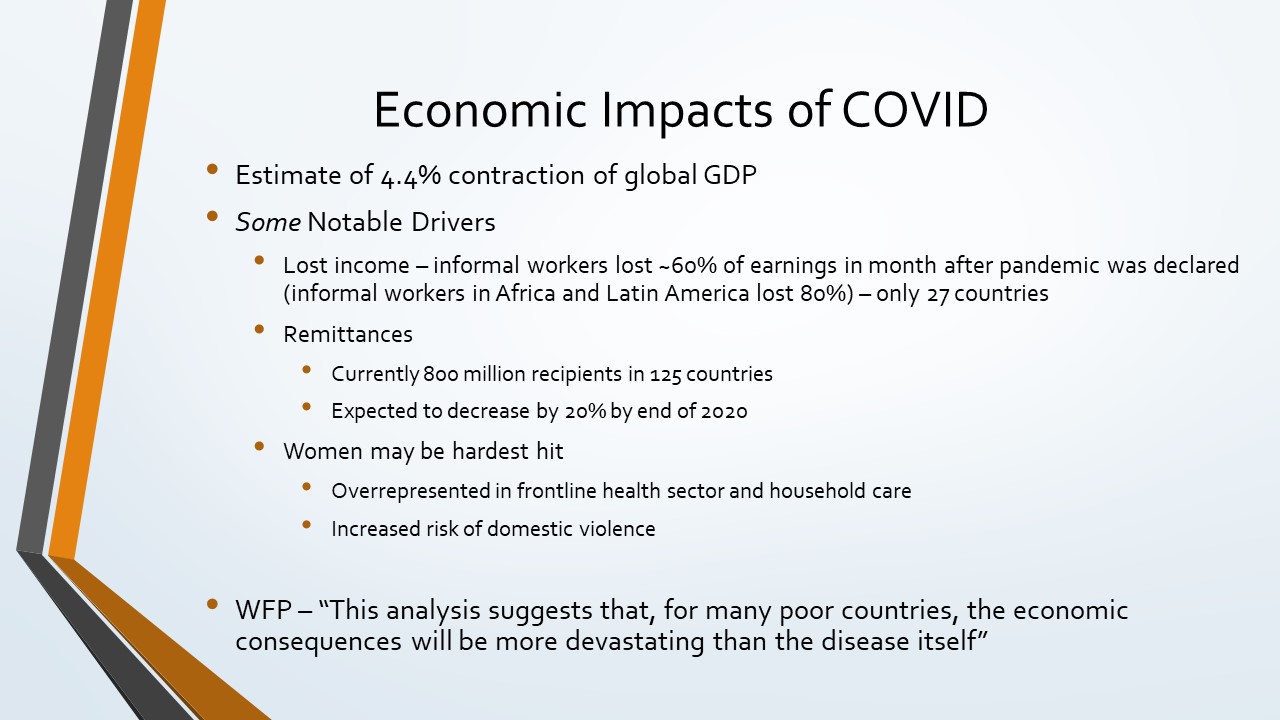
The World Bank estimated that in 2020, COVID would cause a contraction of about 4.4% of global GDP. The consequences are widespread, too. Informal workers, especially, have been hard hit by lost income. Remittances, monies that are sent from workers in one country to families or dependents in their home countries, are down significantly. These were expected to decrease by about 20% in 2020. Women worldwide may be the hardest hit group, because they tend to be overrepresented in particularly vulnerable occupations, such as healthcare and home care, and because they face an added risk of violence at home during shutdowns. One note is worth making here. The World Food Programme’s observation about the economic conseuqneces being more severe than the disease itself is included on the slide. But it is important to remember that these impacts are being measured with the restrictive measures put in place to slow the pandemic in mind. Without these restrictions, the disease itself would also have severe impacts, including much wider loss of life.

All this combines to make some pretty stark projections for poverty worldwide.

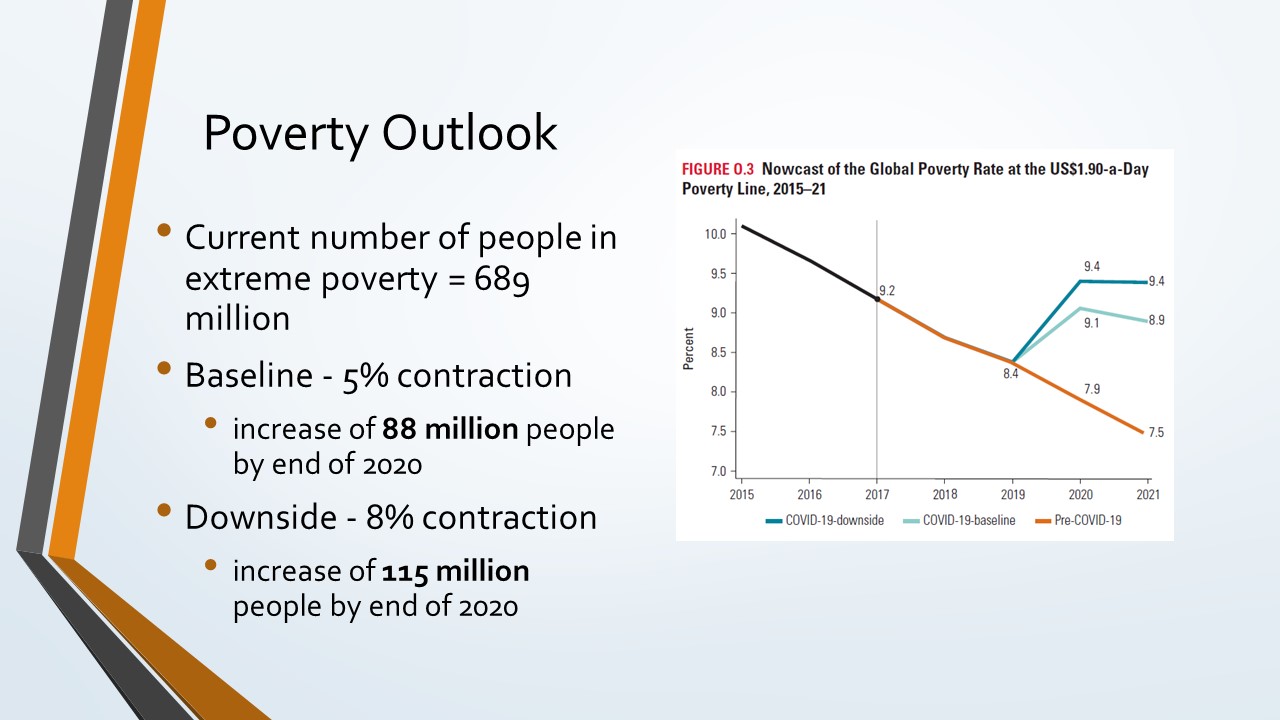
The current number of people living in poverty is 689 million. If global GDP contracts by 5%, then an additional 88 million people will have been added to that number by the end of 2020. If global GDP contracts by 8% (the high end of estimates), then we will be looking at an increase of 115 million, or a total of 804 million people in poverty. Remember, these were estimates for the end of 2020. With the pandemic still raging into 2021, these projections may be worse now, and in fact, some data suggest that global GDP already contracted by more than 5% by the end of last year.

Now to hunger. Last year, there were two estimates floating around that seem to have caused some confusion. Back in April 2020, the World Food Programme (WFP) announced that the number of people facing hunger could double by the end of the year, to 265 million.

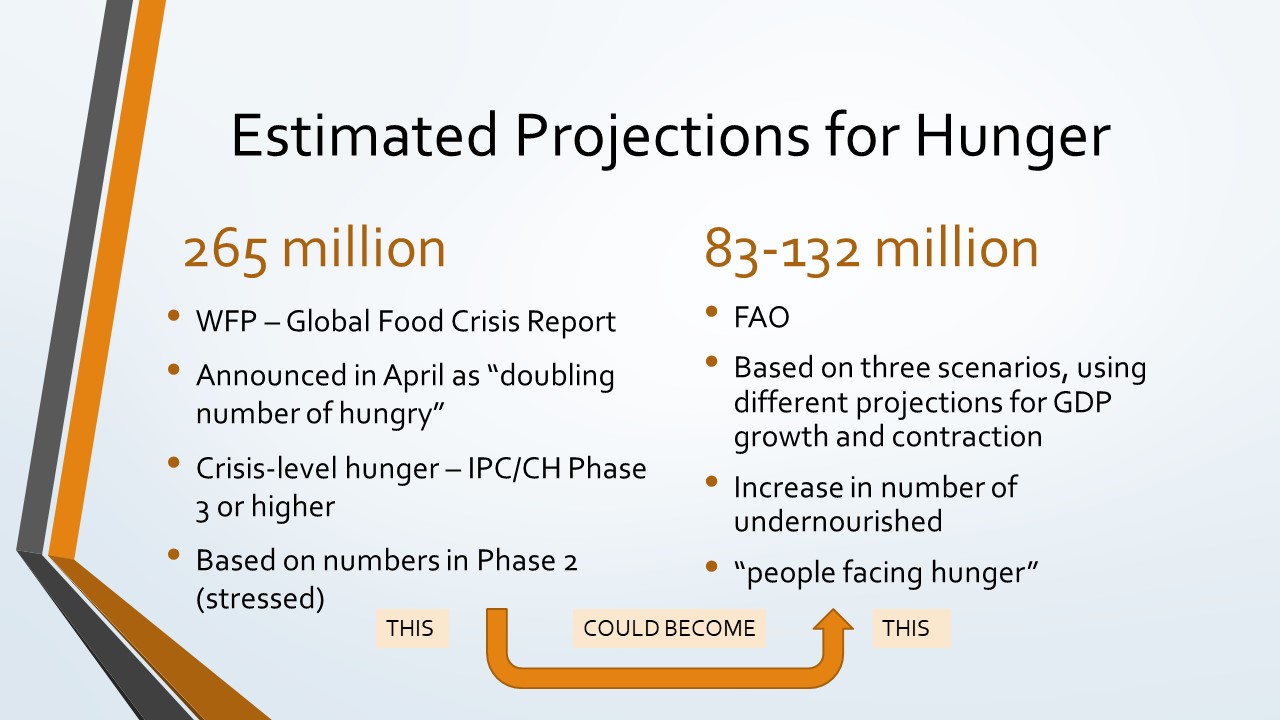
“But, wait!” you might say, “I thought the number of hungry people was almost 690 million.” What the WFP was referring to is the number of people facing what is called “crisis-level hunger,” based on a classification called IPC/CH Phase 3. This is, as the term implies, a short-term crisis of hunger, not the long-term undernourishment we refer to typically as “hunger.” The estimate is based on the number of people who are vulnerable to a crisis (in the earlier phase of IPC/CH) falling into crisis-level hunger in 2020.

An estimate that more closely tracks with what we have been calling “hunger” is the Food and Agriculture Organization of the United Nations’ (FAO) estimate of 83 to 132 million people. This maps to the statistic that ELCA World Hunger and other organizations use to refer to “people who are hungry,” namely the number of people who are undernourished.

So, the 265 million people from the WFP’s estimate could become part of the population that is chronically undernourished, but the two estimates refer to different things. The most consistent way to talk about COVID’s impact on hunger, then, would be to say that the number of people who are chronically undernourished could have grown by 83 to 132 million by the end of 2020, while as many as 265 million more people could be facing a hunger crisis. We’ll need to wait for new data later this year to see how close the estimates were.

The key point here is that the most conservative estimate was that both hunger and poverty each grew by about 12 percent in the last year. That is a staggering number.

And, as the slide mentions, there is not a single root cause of hunger that is not untouched by the pandemic, from employment to health care to food access to climate change. Everything is affected.

Domestic United States

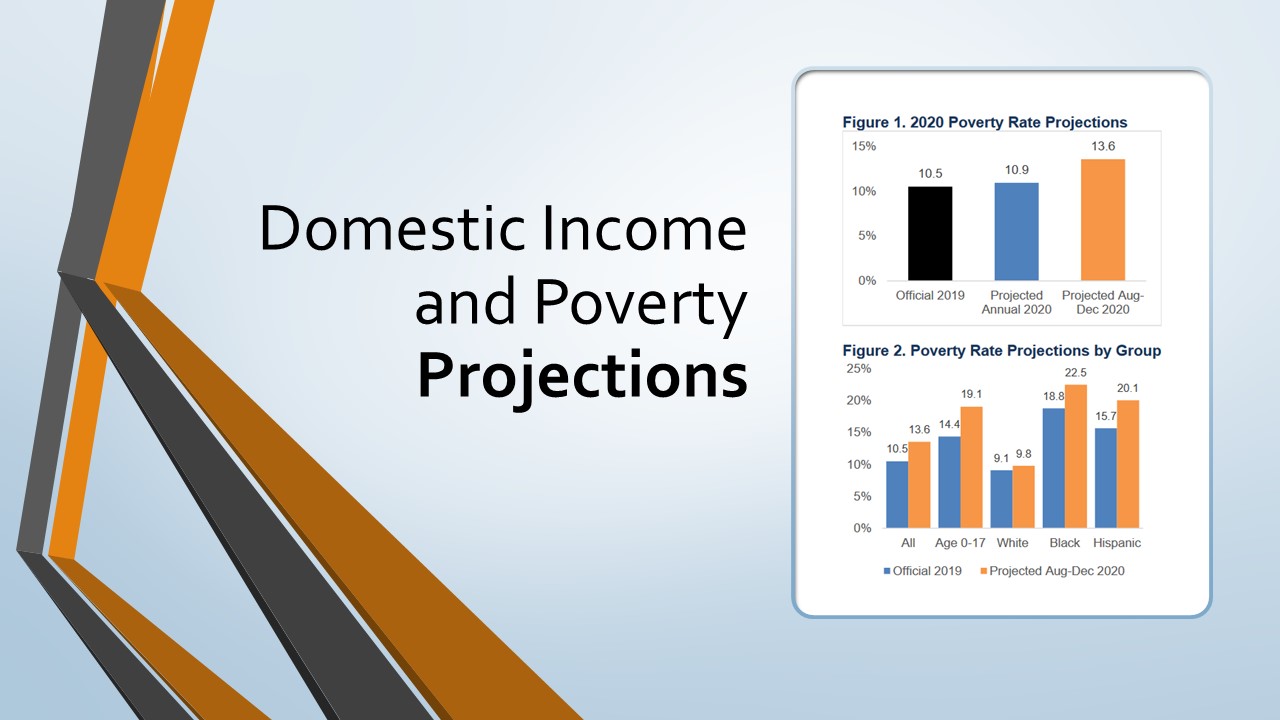
The news for the US isn’t much better, though federal legislation (through the CARES Act, the HEROES Act and the COVID relief included in the spending reauthorization bill) have masked some of the possible effects of the pandemic. Using Census data on poverty and income, the US Department of Health and Human Services estimated in October that poverty would grow to 10.9% by the end of the year, with a big jump in the Fall and early Winter. As you can see in the slide, though, the rates and estimates reflect what we already know about racial disparities in poverty in the US:

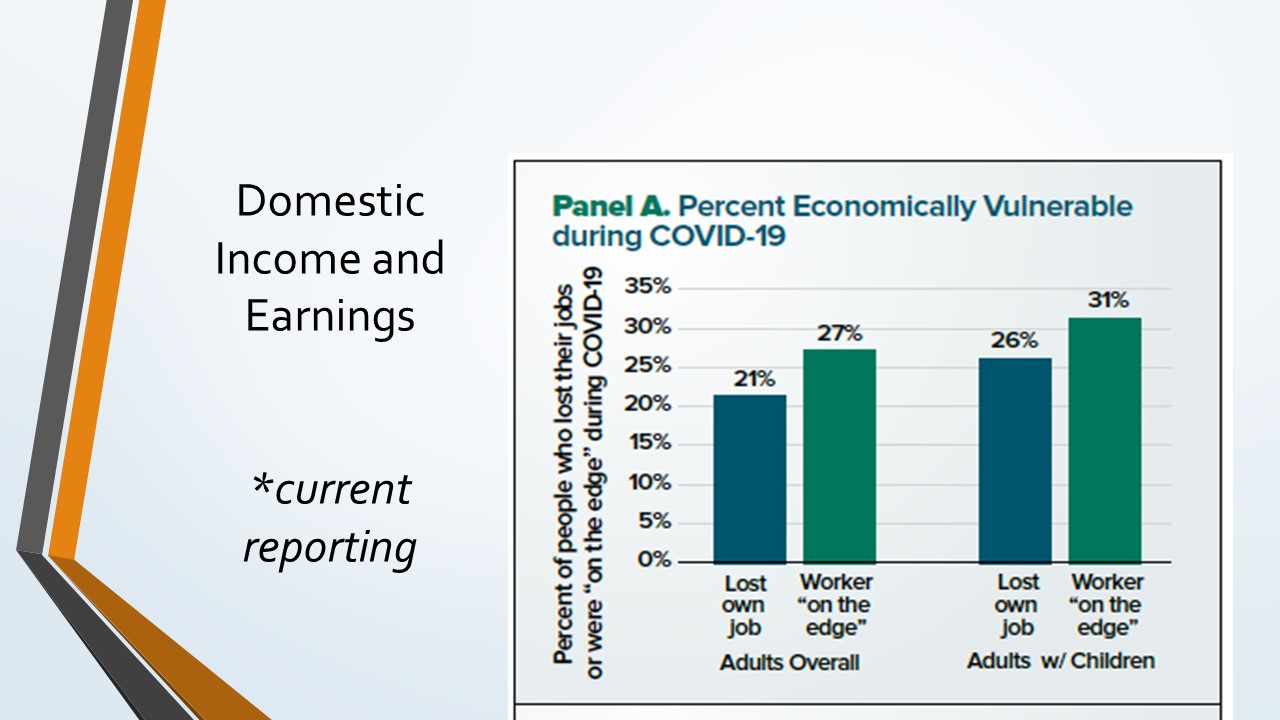
The Food Research and Action Center (FRAC) did an analysis of economic vulnerability that was really disheartening. FRAC estimates that almost 50% of adults in the US either lost their own job or were “on the edge,” which means they experienced a loss of income or reduced hours, expected to lose their job, or had a household member lose their job during COVID.

So, what does this mean in the US? First, estimates suggest that domestic hunger has already doubled or tripled since the start of the pandemic. More than a quarter of US adults are economically insecure. Importantly, the social safety net – including increases to or easing restrictions of programs like SNAP and WIC, eviction moratoria, and the expansion of the school meals program for children – have been working. Sort of. They aren’t enough, and many of the programs still aren’t available to everyone. But they have helped dampen some of the effects of the pandemic. That’s important to remember. These estimates and projections are what we have with this legislation. One can only imagine what would have happened without it.

One of the most worrisome trends is in food security in the US, which has spiked incredibly since early 2020. What is very concerning here is that we may be seeing a shift from “recurrent not chronic” hunger in the US to chronic hunger for many people.

And there we have it. We are still using the data available to us last year, covering hunger and poverty from 2019, generally, but we know that the situation has dramatically worsened, even since these reports were published. In the US, vaccination has given some a measure of hope, but access to vaccines and treatments is still far below what it needs to be in many places around the world. We are far from the end in terms of the economic impact of this. We need only recall how long it took the US to recover from the Great Recession (nearly a decade). The economic impact of COVID is much broader and deeper than even this. We have a long road ahead, as a country and a world.

Sometimes, faithful hope can be like standing on the deck of a ship watching as the port gets nearer. And sometimes, faithful hope is like clinging to a float in the middle of the ocean. We need to be honest about the projections we are seeing, but in times like these, we also need to cling in hope to what we are equally assured of by faith.

We don’t need to change the story; we just need to be faithful to the story we trust in by faith. The only future that has been written in stone is a future without hunger and thirst.

We give thanks for the work that many of you are doing to address this deep, deep need, through your local ministries, advocacy, generosity and through the work we do together as ELCA World Hunger. May God continue to make a blessing of your efforts.

You can download the slides for this presentation here: ELCA World Hunger Hunger and Poverty Statistics for 2020


Share

World Malaria Day 2019


To most of us in the United States, mosquitoes are nothing more than a pest. But in many places around the world, just one bite from an infected mosquito could transmit malaria. Every two minutes, a child dies from malaria – a preventable and curable disease. In a recent report, the World Health Organization warned that progress against malaria has stalled. World Malaria Day is a special time to remember our neighbors at heightened risk for this disease – and the ways God is working through and with them to reduce risk and build resilience.

More research needs to be done to help describe the relationship between hunger and malaria, but what we do know is that ending hunger means helping communities find ways to stay healthy. When malaria affects young children, costs for medicine, doctor visits, and transportation to health facilities can quickly add up. If an adult contracts the disease, it can mean time away from work, which makes it harder for their families to meet their needs.

But even seemingly simple interventions can make a big difference. One study from Zambia found that providing farmers with bed nets to prevent mosquito bites contributed to an increased output from their farms of more than 14 percent. A bigger harvest means more crops, more money, and less risk of hunger or poverty for a family. The interconnections between hunger and malaria – and the intertwined solutions to both – are one reason ELCA World Hunger continues to support efforts to address malaria.

Strategies for preventing malaria are just some of the ways the ELCA’s companion churches are accompanying neighbors in their communities. Though the ELCA’s Malaria Campaign officially ended in 2015, this important work continues in several countries.

Incidences of malaria can affect a family’s income, but the reverse is true, too. Increases in household income can reduce the likelihood of contracting malaria and make it easier for a family to afford treatment if someone gets sick. Building resilience by increasing opportunities for income generation is at the heart of the Evangelical Lutheran Church in Zimbabwe’s (ELCZ) savings and lending projects in Zimbabwe. Here, the ELCZ helps community members form village savings and loan groups (VSLAs) and provides training to strengthen existing skills in tasks such as bookkeeping.

In the Hwange District, Bulowe Nyoni was responsible for getting a water well built that now serves as a source of drinking water for most of her neighbors. From her savings, she also started an organic garden near the well. As a volunteer in the project, Bulowe received two goats, which have now multiplied to over 30, thirteen of which she sold to buy a cart that allows her to fetch firewood and other items. In addition, Bulowe also works as a volunteer in health clinic where she conducts health talks for patients. Because of her efforts, her community has access to clean water, patients in the clinic receive the support and information they need, and Bulowe is able to earn and save the income that builds resilience to both malaria and hunger for her household.

Memory Hove, popularly known as Mai Mdlungu, is a member of a savings and loan group in the district of Gokwe North. She and a group of 25 other women started the group in 2015. Initially, her husband was opposed to the idea. But Mai Mdlungu was determined, and she started raising money by baking and selling buns in her community and used part of the money to save with the other women. By the end of the first cycle of the savings and lending group, she received goats that she has been raising and breeding. These goats now help her pay for her children’s school fees. In 2016, she used her share of savings from the group to buy a cow, which has since given birth to a calf.

Seeing Mai Mdlungu succeed challenged her husband’s first impressions of the group. “I got married to an industrious woman,” he says, “and she has just woken me up from my deep slumber.” Mai Mdlungu’s husband joined the group and, at the end of the 2018 cycle, used his savings to purchase maize seed and fertilizer. Other couples are following their example, with men joining the savings and loan groups alongside women. This helps to strengthen the relationships within the family and, in Mai Mdlungu’s case, provide the opportunity for women to be part of the decision-making processes in their families.

These kinds of projects address the deep problem of malaria in holistic and transformative ways by building resilience and reducing risk. Because of the skills, talents, and hard work of community members like Bulowe and Mai Mdlungu, these projects are changing the lives of members of their communities and families. This work helps their families be less likely to contract malaria, less likely to face hunger and poverty, and more likely to be able to weather an illness if someone gets sick. And their efforts are helping to “wake up” others to the hope for a future free of malaria and hunger.

To support this ongoing work through ELCA World Hunger, please visit https://community.elca.org/good-gifts-2017/health.


Share

World Malaria Day 2018 – Updates from the Field


From 2011 to 2015, the ELCA Malaria Campaign raised both awareness about malaria and gifts to support companion churches and partners in fourteen countries to combat this disease. These gifts continue to support projects in countries faced with the daunting challenges posed by malaria. This World Malaria Day, we celebrate this important work that continues through the ELCA’s companion churches. As we commemorate World Malaria Day this year, we do so with firm resolve to keep up this important work. According to the World Health Organization, there were 216 million estimated cases of malaria in 2016 (the most recent year data is available.) This is a significant decrease from the 237 million cases WHO estimated for 2010, which enlivens hope that we can reduce vulnerability to this disease. Yet, we also know that progress has slowed. The 2016 estimates represent an increase from 2015, when WHO reported 211 million cases.

 Clearly, there is more to be done. But ELCA World Hunger, our partners, and our companions also celebrate the progress that has been made and the impact this work has had in communities. Below are updates from some of the countries where malaria work continues. For more on the malaria programs in Zimbabwe from ELCA staffmember David Mills, see this post.

Malawi

Income generation and savings is a key part of the Evangelical Lutheran Church in Malawi’s work, as well. In 2017, their village savings and loan programs reached more than 2,100 members, who collectively saved nearly $167,000 dollars. These savings have helped the participants—88 percent of whom are women—gain increased access to health services, loans, and education while improving the overall food security of their households. The members were also able to make improvements to their homes and purchase assets that will help them generate income. All of these results will help them be more resilient to malaria outbreaks.

Namibia

Community members clear tall grass at Engela Hospital.

To reduce the population of mosquitos that carry the malaria parasite, removing brush and tall grasses that would allow standing water to collect near homes is critical. In Ruacana, 349 people from seven villages came together with the Evangelical Lutheran Church in Namibia (ELCIN) to implement a major cleaning campaign to reduce the risk of malaria. The Regional Councillors’ office helped by providing transportation for the large group. More than 100 participants joined in two other cleaning campaigns in Okongo and Engela districts, especially targeting the area around the hospitals in those communities.

Education about spraying continues to be a key priority for the ELCIN. When participants in their malaria program in Zambezi reported that many people refused to allow sprayer operators into their homes, the church began an intensive awareness campaign and hosted workshops with community leaders. With the knowledge they gained and the trust that was built in the workshops, the community leaders became active advocates for indoor spraying, assisting the program leads and offering support to sprayer operators. The ELCIN now reports that 89% of the homes in Zambezi have participated in indoor spraying, a key best practice in reducing the risk of malaria.

Zimbabwe

Malaria is a disease of poverty. On the one hand, the disease itself contributes to high rates of poverty because of lost productivity, lost wages due to illness or death, lower school attendance, and increased health care costs. On the other hand, poverty can also make a community more vulnerable to malaria by decreasing the availability of social services, including health care and prevention education.

This is why income-generating activities are a key part of the Evangelical Lutheran Church in Zimbabwe’s (ELCZ) response to malaria. In Hwange and Gokwe districts, community members took time to celebrate the hard work of people involved in the ELCZ’s livelihoods projects. In Gokwe, groups participated in field days at a local level, showcasing a variety of products, including organic honey, organic milled small grains, protein-rich nuts, sun-dried vegetables, and soups. Some of the products were collected and exhibited at a district-wide field day. The exhibit of products won an award for best exhibit in the social services category. More than just celebrating the work of the groups, the exhibits gave them an important opportunity for feedback on product quality and branding.

In Hwange, the ELCZ held a field day where groups could come together and share experiences and best practices. Groups also had the chance to showcase the products they had developed. The group members helped make the field day a successful celebration, mobilizing resources for food and prizes for the presenters.

The ELCZ’s work has made a tremendous impact on individuals and communities. Gogo Lucy Mloyi, a 60-year-old widow in Mfelandawonye, has been a member of a village savings and loan group since 2013. The group has been a blessing for Gogo Mloyi as she works to raise chickens for eggs and meat. Through her hard work and the support she has, Gogo Mloyi was able to build a six-room house, with rooms to rent for added income. She was also able to get electricity in her house to run a deep freezer where she keeps her chickens before they are sold. With the support from the village savings and loan group, Gogo Mloyi is able to meet her needs in her new home.

Gogo Lucy Mloyi

Share

Building the Good Life for All: A New Book from a Familiar Voice


Many folks passionate about hunger issues are familiar with Shannon Jung’s work. He has written extensively on the topics of food and eating from a faith-based perspective. His books include Food for Life: The Spirituality and Ethics of Eating (2004), Sharing Food: Christian Practices for Enjoyment (2006), and Hunger and Happiness: Feeding the Hungry, Nourishing Our Souls (2009). In addition to his perceptive writing on these topics, Dr. Jung is a Presbyterian pastor and professor who has taught at Concordia College (Moorhead, Minn.) and Wartburg Theological Seminary (Dubuque, Iowa) as well as Dubuque Seminary and Saint Paul School of Theology. Below, Jung introduces us to his newest book, Building the Good Life for All: Transforming Income Inequality in Our Communities, available this year from Westminster/John Knox.

We hear a lot about the gap between the economically secure and those just getting by. What we wonder is, “How can we transform this gap in our communities?” We know that this is the sort of neighborliness Christ commended. But still the question: How can we build the good life for all?

Sometimes that neighbor is working hard to get by but seems to be falling behind and going further into debt. Many times, a single expense (doctor’s bill, car accident) will shatter a tight budget and force a family to choose between food or medicine or a house payment. “Getting by” can often be a pretty precarious way to live.

We see the devastation that natural disasters can wreak on vulnerable communities. Yet the income inequality we see now can leave communities vulnerable as well – to hunger, poverty, homelessness, and disease. What can we do about this?

In this new book, Building the Good Life for All: Transforming Income Inequality in Our Communities, the focus in on those who are working but find themselves struggling to get by, including those whose income already leaves them living in poverty.

As I contended in Hunger and Happiness: Feeding the Hungry, Nourishing our Souls, I argue here that our own happiness depends not on the quantity of goods we have stored up, but rather on our efforts to eliminate hunger and to ensure that all have access to the resources for a “good life”. Indeed, our own flourishing is tied into the flourishing of our neighbor. Thus, alleviating suffering and enabling long-term well-being is spiritually uplifting for the receiver, but even more so for the giver.

Building the Good Life for All maintains that our work at enabling all our neighbors to enjoy a good life will enrich our spiritual life. We are interdependent. God creates us like that. Striving to empower all people to have a sufficient and secure life–free from hunger and want–is one step towards recovering what God intended for the world.

This isn’t an attempt to harangue Christians into “doing more.” Instead, the book moves by way of stories from one strategy to another. People and churches are already working to feed the hungry and clothe the naked. They are also engaging in efforts to help people develop skills and abilities that will enable them to feed and clothe themselves. So, what the body of the book contends is that this effort is already underway and that Christians could enrich themselves by joining them or initiating similar efforts in their communities.

The beginning focus is on the specific community of Manatee and Sarasota counties in Florida, but many of the efforts there (advocacy, food pantries, tutoring programs, congregational-based community organizations) have branches around the country. So, the question is, “What fits your community?” There will be other similar efforts in your community. Many of the chapters in the book focus on one of four strategies:

  1. Relief: This is the sort of program that a crisis like a hurricane calls for–feeding the hungry, finding clean water for the thirsty, making sure people are free from illness.
  2. Self-Development: Here, churches can come alongside the working class and poor to assist them to learn English, to learn household management, to develop job skills, to get a job or to get a better job. People are thus able to feed themselves.
  3. Public opinion formation: The church’s hunger ministries are efforts to shape public opinion in such a way as to see hunger as a scandal in the land of the free.
  4. Public policy advocacy: This is the sort of work that ELCA Advocacy does with its partners, including Bread for the World, to influence legislation that will guarantee an income floor for all people and to support the rights of workers. It also includes such efforts as Fight for Fifteen – the movement to raise the minimum wage, and working to make affordable housing more accessible.

I strongly hope this book will be used by adult Christian education groups in churches. Each chapter has a list of discussion questions to spark conversation, and the last chapter encourages churches to develop or extend their own work. It is helpful that the operating assumption is that churches and other organizations are already doing this and the encouragement is to develop efforts that fit one’s own context.

In addition to the discussion questions in the book, there will be a video series to accompany the text, to help facilitate use by congregations.  Building the Good Life for All: Transforming Income Inequality in Our Communities is now available on sale from the Presbyterian Church (USA) store at https://www.pcusastore.com/Products/0664263186/building-the-good-life-for-all.aspx.

Share

New Data on Poverty and Food Security Show Positive Trends, More Work to Do


Each year, the United States Census Bureau updates the statistics on poverty, health care coverage, and the median income for Americans. This research gives us not only a glimpse into how the country is faring in terms of economic opportunity for a given year but also a broad view of historical trends year-over-year.

Around the same time, the United States Department of Agriculture releases new data on food security in the United States. These data help us see how the country is faring in terms of access to healthy, safe food for Americans.

The data for 2016 were released last week and contained few surprises. Before getting into the numbers, though, here’s a few helpful notes on the Census reports. (Many thanks to the Coalition on Human Needs, an alliance of nonprofit organizations that hosts an annual webinar on the census data.)

  • The data are collected annually through two tools: the Current Population Survey (CPS) and the American Community Survey (ACS). Both provide information on similar issues, but the ACS involves a much larger sample, making it possible to get statistics for smaller datasets. For example, you can use the ACS to find the rate of poverty in your state, county or congressional district.
  • The rate of poverty is calculated for the previous year based on the official poverty thresholds for households based on household size. Households with annual income below the thresholds are considered to be poor. This matters a great deal, since some means-based public support – SNAP, TANF, etc. – are based on the poverty thresholds. For 2016, the year measured by the CPS and ACS in the newest data, the thresholds are:
    • 1 person, average – $12,234
    • 1 person, below 65 years old – $12,486
    • 1 person, above 65 years old – $11,511
    • 2 people – $15,585
    • 3 people – $19,109
    • 4 people – $24,563
  • In addition to the official poverty rate, the Census Bureau provides data based on the “Supplemental Poverty Measure.” The Supplemental Poverty Measure has a few key differences that make it interesting. First, it includes forms of “income” that the official measure does not, for example, Social Security income, SNAP benefits, housing assistance and tax credits. It also makes adjustments in the poverty thresholds based on housing costs in a local geographic area. This makes the SPM fascinating, since it can be used to track the effect things like SNAP benefits, Social Security and medical out-of-pocket costs have on the rate of poverty in the US. For example, we can use the SPM to see what the rate of poverty might be without a program like SNAP. Or, we could use it to estimate what the rate of poverty would be if households had no medical out-of-pocket costs.
  • To be statistically significant, the poverty rate has to change by at least .2 or .3 percent. For example, a change in the poverty rate from 15.5% to 15.4% is not statistically significant. For median income, the change has to be about 1 percent to be significant. (Thanks Jared Bernstein, Senior Fellow at the Center for Budget and Policy Priorities for his analysis here.)

Alright, enough notes. Here’s the numbers:

Food Security – 2016

  • 3 percent of Americans – about 15.6 million households – were food insecure at some point during the year. This is down, but not significantly, from 12.7 percent in 2015. It is a significant decline from 2014, though, when 14 percent of Americans reported experiencing food insecurity in 2014.
  • 9 percent of people in the US – about 6.1 million households – had very low food security in 2016, which means that their food intake was reduced and their normal eating patterns were disrupted at some point during the year. This is essentially the same rate as 2015, when 5 percent of households reported low food security.
  • 5 percent of households with children experienced food insecurity in 2016. One interesting note here is that in 8.5 percent of households with children, only the adults were food-insecure. This may be due to the tendency of adults to reduce their own food intake and change their eating habits to ensure that children have enough to eat. Still, in 298,000 households, children, too, experienced disruptions in their food intake due to food insecurity.
  • As you can see in the graph below, the Great Recession caused spikes in food insecurity, which have since abated. But food insecurity still hasn’t declined to what it was before the recession.

Poverty

  • In 2016, 12.7 percent of Americans – about 40.6 million people – were living in poverty. This is a decline from 13.5 percent in 2015.
  • While still high, the new rate reflects the biggest two-year decline in poverty in nearly 50 years. 2.5 million Americans who experienced poverty in 2015 had incomes in 2016 that were above the poverty threshold (see above.) This is a tremendous positive change.
  • The number of children living in poverty continues to be high, though we did see a reduction in the number of children living in impoverished households from 2015 to 2016. In 2015, 14.5 million children were living in poverty. In 2016, the number dropped to 13.2 million.
  • The Supplemental Poverty Measure demonstrates the huge impact that government programs have had on the rate of poverty in the United States. For example, Social Security helped 26 million people from experiencing poverty. The Supplemental Nutrition Assistance Program (SNAP) reduced the number of people in poverty by almost 3.6 million.
  • Higher income may be part of the reason for the decline in poverty. For the second year, the median income for American households increased, to $59,039 in 2016. This is still lower than it was before the Great Recession ($59,992 in 2007), but it shows a positive trend, at least from 2014 to 2016.
  • Interestingly, this growth is not necessarily attributable to a growth in wages. Rather, the most likely reasons seem to be higher employment and the effects this has on household income. Wage growth, unfortunately, remains slow.

Altogether, the news from the US Census Bureau shows the positive effects of economic growth, as well as the importance of public programs like Social Security, SNAP, housing assistance and others. For a full report on the new data, see  https://www.census.gov/topics/income-poverty/poverty.html.


Share