Each year, the United States Census Bureau updates the statistics on poverty, health care coverage, and the median income for Americans. This research gives us not only a glimpse into how the country is faring in terms of economic opportunity for a given year but also a broad view of historical trends year-over-year.
Around the same time, the United States Department of Agriculture releases new data on food security in the United States. These data help us see how the country is faring in terms of access to healthy, safe food for Americans.
The data for 2016 were released last week and contained few surprises. Before getting into the numbers, though, here’s a few helpful notes on the Census reports. (Many thanks to the Coalition on Human Needs, an alliance of nonprofit organizations that hosts an annual webinar on the census data.)
- The data are collected annually through two tools: the Current Population Survey (CPS) and the American Community Survey (ACS). Both provide information on similar issues, but the ACS involves a much larger sample, making it possible to get statistics for smaller datasets. For example, you can use the ACS to find the rate of poverty in your state, county or congressional district.
- The rate of poverty is calculated for the previous year based on the official poverty thresholds for households based on household size. Households with annual income below the thresholds are considered to be poor. This matters a great deal, since some means-based public support – SNAP, TANF, etc. – are based on the poverty thresholds. For 2016, the year measured by the CPS and ACS in the newest data, the thresholds are:
- 1 person, average – $12,234
- 1 person, below 65 years old – $12,486
- 1 person, above 65 years old – $11,511
- 2 people – $15,585
- 3 people – $19,109
- 4 people – $24,563
- In addition to the official poverty rate, the Census Bureau provides data based on the “Supplemental Poverty Measure.” The Supplemental Poverty Measure has a few key differences that make it interesting. First, it includes forms of “income” that the official measure does not, for example, Social Security income, SNAP benefits, housing assistance and tax credits. It also makes adjustments in the poverty thresholds based on housing costs in a local geographic area. This makes the SPM fascinating, since it can be used to track the effect things like SNAP benefits, Social Security and medical out-of-pocket costs have on the rate of poverty in the US. For example, we can use the SPM to see what the rate of poverty might be without a program like SNAP. Or, we could use it to estimate what the rate of poverty would be if households had no medical out-of-pocket costs.
- To be statistically significant, the poverty rate has to change by at least .2 or .3 percent. For example, a change in the poverty rate from 15.5% to 15.4% is not statistically significant. For median income, the change has to be about 1 percent to be significant. (Thanks Jared Bernstein, Senior Fellow at the Center for Budget and Policy Priorities for his analysis here.)
Alright, enough notes. Here’s the numbers:
Food Security – 2016
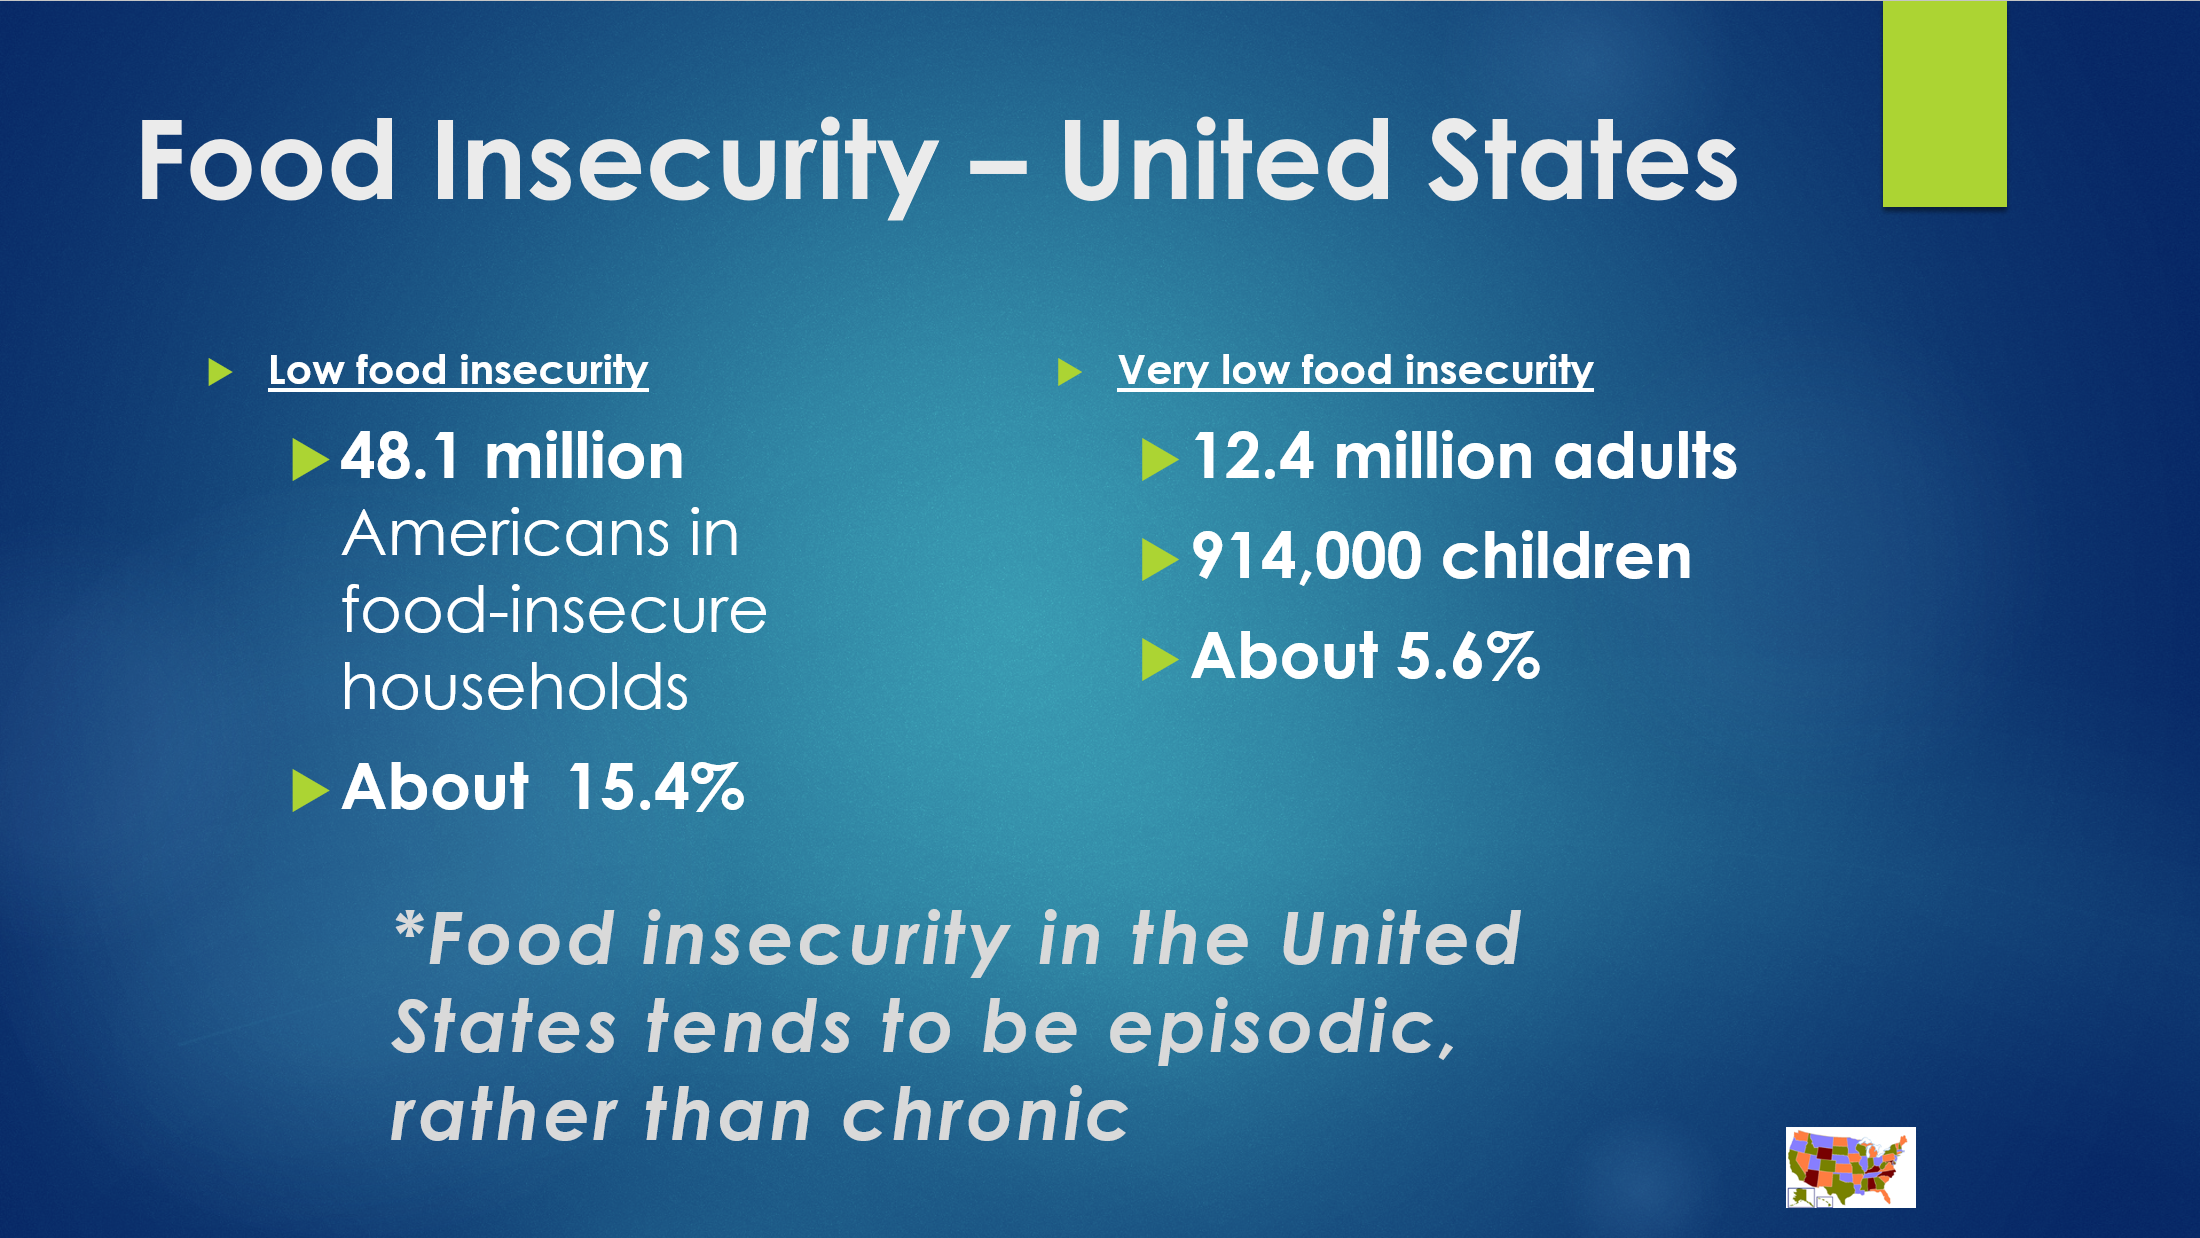
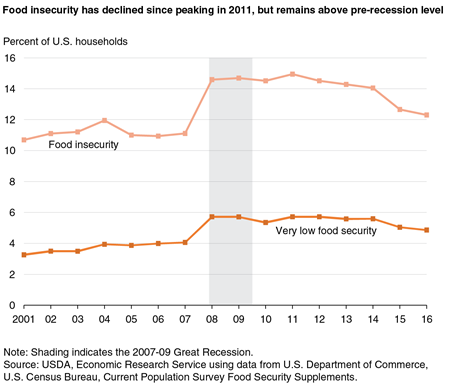
- 3 percent of Americans – about 15.6 million households – were food insecure at some point during the year. This is down, but not significantly, from 12.7 percent in 2015. It is a significant decline from 2014, though, when 14 percent of Americans reported experiencing food insecurity in 2014.
- 9 percent of people in the US – about 6.1 million households – had very low food security in 2016, which means that their food intake was reduced and their normal eating patterns were disrupted at some point during the year. This is essentially the same rate as 2015, when 5 percent of households reported low food security.
- 5 percent of households with children experienced food insecurity in 2016. One interesting note here is that in 8.5 percent of households with children, only the adults were food-insecure. This may be due to the tendency of adults to reduce their own food intake and change their eating habits to ensure that children have enough to eat. Still, in 298,000 households, children, too, experienced disruptions in their food intake due to food insecurity.
- As you can see in the graph below, the Great Recession caused spikes in food insecurity, which have since abated. But food insecurity still hasn’t declined to what it was before the recession.
Poverty
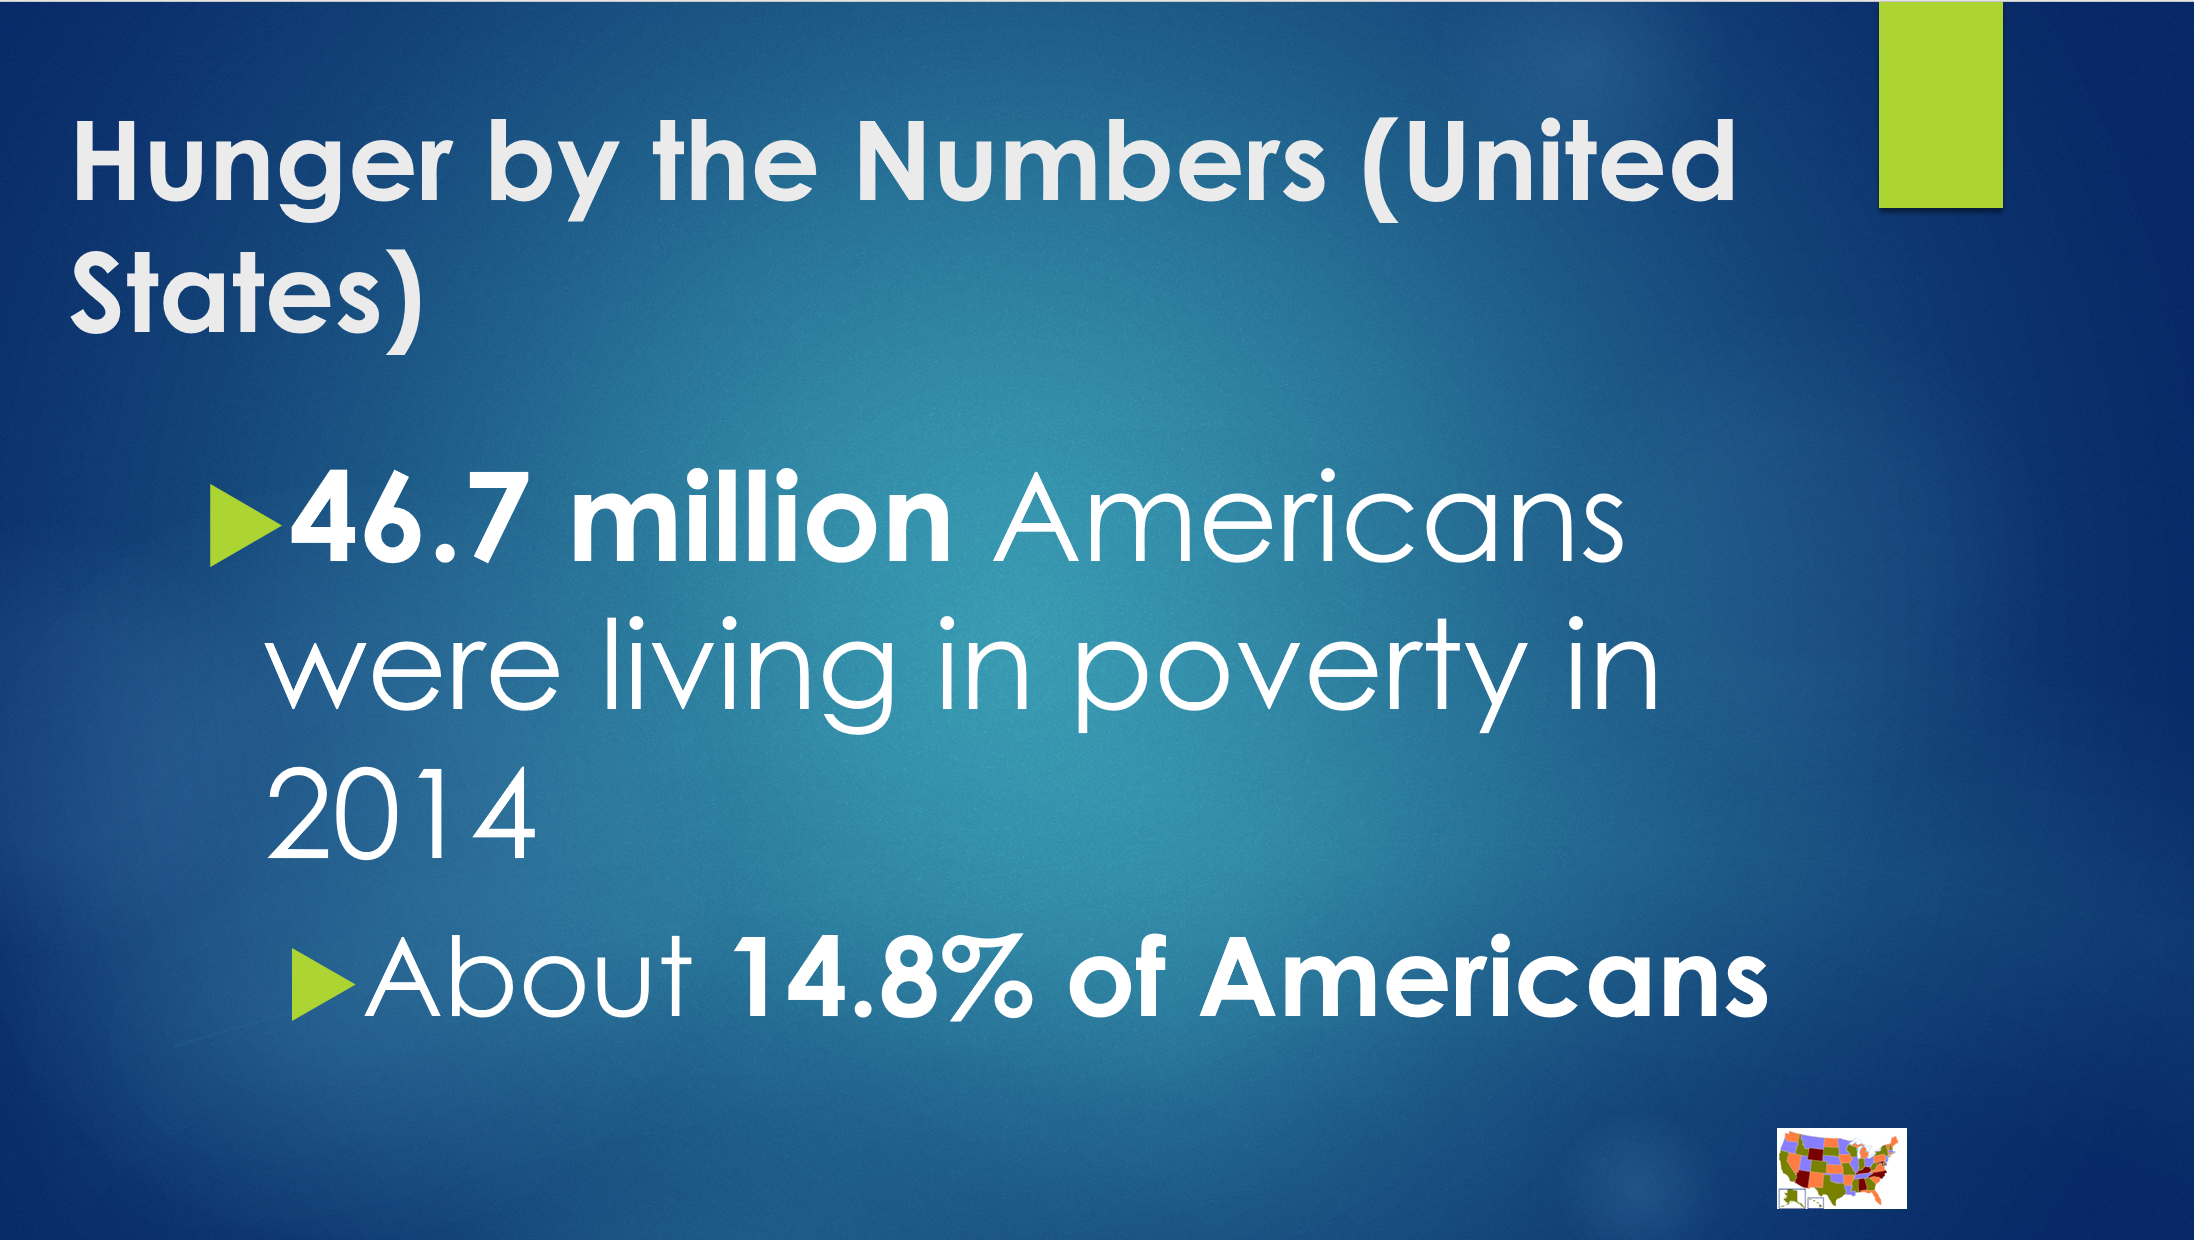
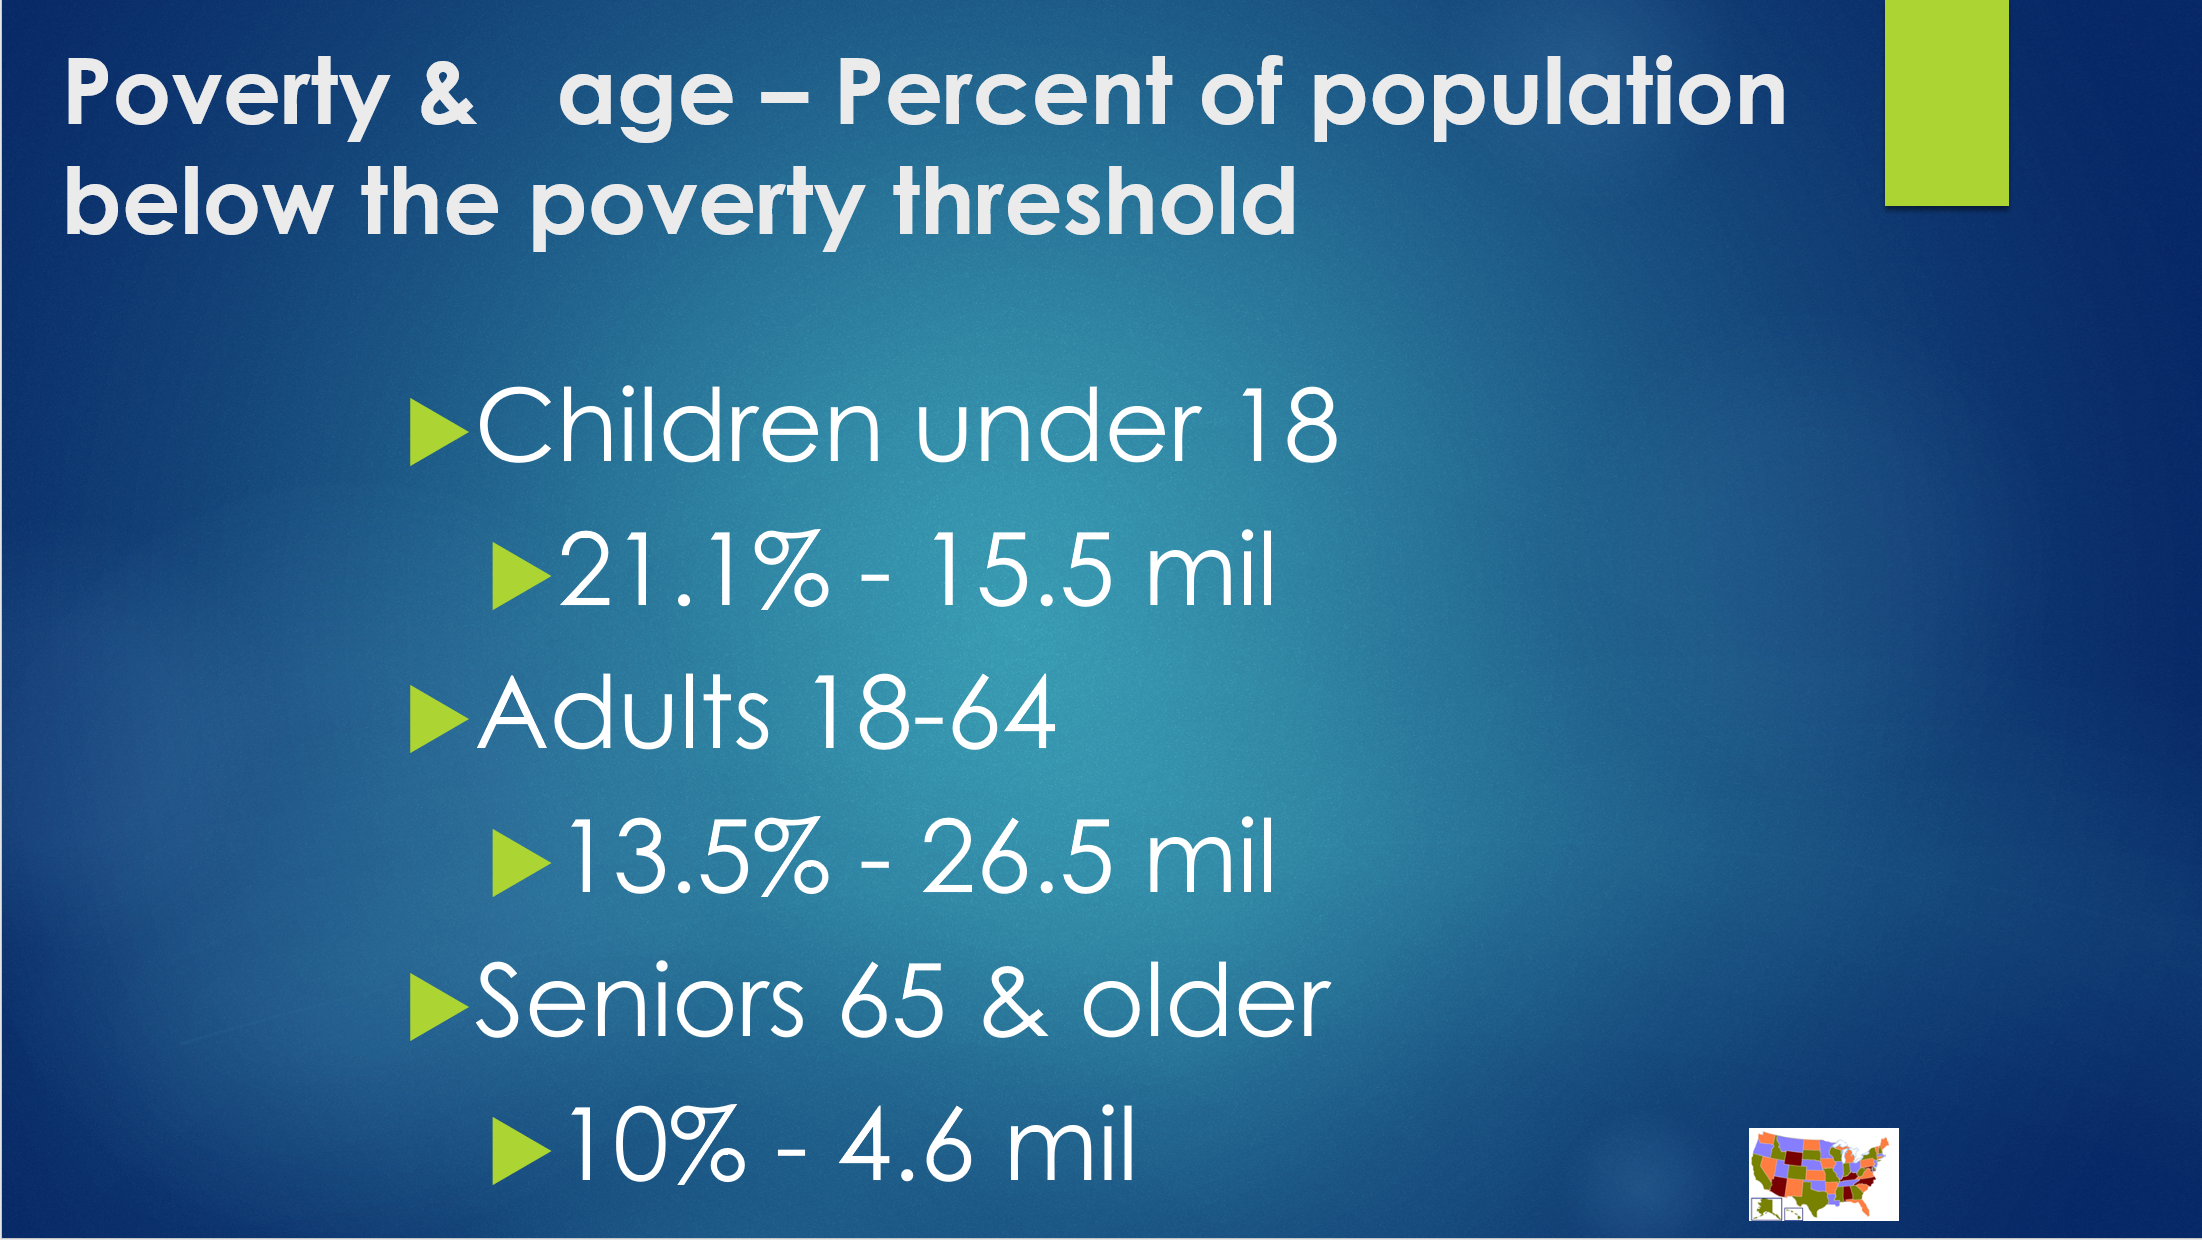
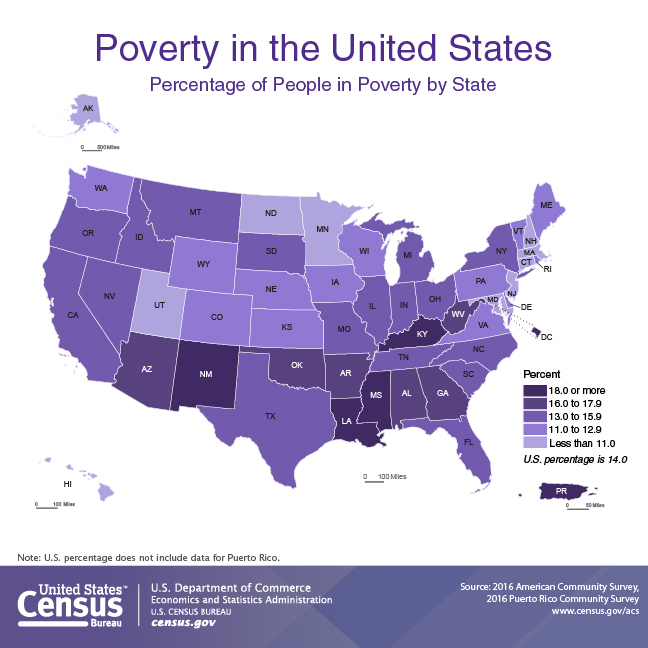
- In 2016, 12.7 percent of Americans – about 40.6 million people – were living in poverty. This is a decline from 13.5 percent in 2015.
- While still high, the new rate reflects the biggest two-year decline in poverty in nearly 50 years. 2.5 million Americans who experienced poverty in 2015 had incomes in 2016 that were above the poverty threshold (see above.) This is a tremendous positive change.
- The number of children living in poverty continues to be high, though we did see a reduction in the number of children living in impoverished households from 2015 to 2016. In 2015, 14.5 million children were living in poverty. In 2016, the number dropped to 13.2 million.
- The Supplemental Poverty Measure demonstrates the huge impact that government programs have had on the rate of poverty in the United States. For example, Social Security helped 26 million people from experiencing poverty. The Supplemental Nutrition Assistance Program (SNAP) reduced the number of people in poverty by almost 3.6 million.
- Higher income may be part of the reason for the decline in poverty. For the second year, the median income for American households increased, to $59,039 in 2016. This is still lower than it was before the Great Recession ($59,992 in 2007), but it shows a positive trend, at least from 2014 to 2016.
- Interestingly, this growth is not necessarily attributable to a growth in wages. Rather, the most likely reasons seem to be higher employment and the effects this has on household income. Wage growth, unfortunately, remains slow.
Altogether, the news from the US Census Bureau shows the positive effects of economic growth, as well as the importance of public programs like Social Security, SNAP, housing assistance and others. For a full report on the new data, see https://www.census.gov/topics/income-poverty/poverty.html.